Band 4.5 IELTS Writing Task 1 Model Answer
Overall Band Score: 4.5 · IELTS Complete Catalyst · 2026-11-17
IELTS Writing Task 1 question
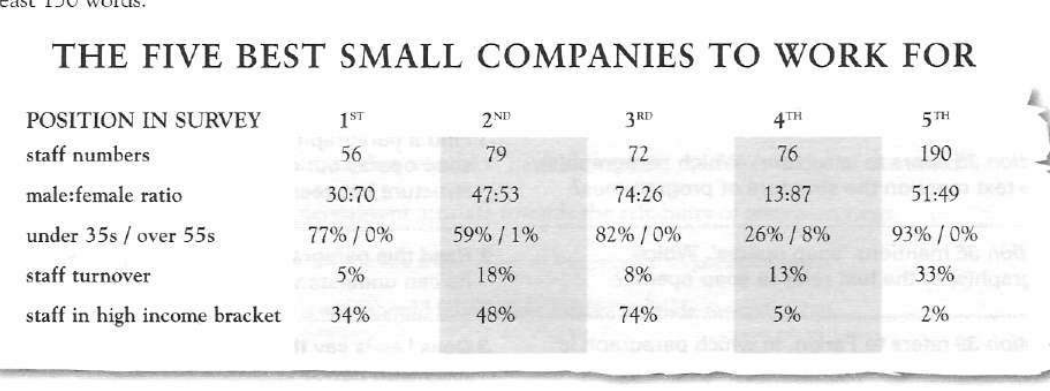
The table below gives information about the five small companies in Britain that came top in a survey of staff conducted by a national newspaper to find out which companies are the best to work for.
Summarise the information by selecting and reporting the main features, and make comparisons where relevant.
THE FIVE BEST SMALL COMPANIES TO WORK FOR
Student answer (Band 4.5)
The table illustrates the data on the five small companies in Britain that came top in a survey of staff conducted by a national newspaper to find out which companies are the best to work for.
Overall, a survey of staff conducted by staff number, male:female ratio, under 35s/over 55s, staff turnover, staff in high income bracket.
The 1st position in surveystaff number for 56, male:female ratio 30:70,under 35s/over 55s for 77%/0%,staff turnover percentage of 5%, staff in high income bracket for 34%.
The 2nd position in surveystaff number for 79, male:female ratio figur of 47:53,under 35s/over 55s for 59%/1%, staff turnover the proportion of 18% and staff in high income bracket for 48%.
The 3rd position in surveystaff number for 72,, male:female ratio 74:26,under 35s/over 55s for 82%/0%,staff turnover percentage of 8%, staff in high income bracket for 74%
The 4th position in surveystaff number for 76,, male:female ratio 13:87,under 35s/over 55s for 26%/8%,staff turnover percentage of 13%, staff in high income bracket for 5%.
The 5th position in surveystaff number for 190, male:female ratio 51:49,under 35s/over 55s for 93%/0%,staff turnover percentage of 33%, staff in high income bracket for 2%.
AI examiner evaluation
| Criterion | Band |
|---|---|
| Task Achievement / Task Response | 4.0 |
| Coherence and Cohesion | 4.5 |
| Lexical Resource | 5.5 |
| Grammatical Range and Accuracy | 4.5 |
| Overall | 4.5 |
Task Achievement / Task Response: Band 4.0
You identify the table’s subject and report the figures for all five companies, and the values you give are generally accurate. However, the response mainly lists data company by company rather than summarising the most important features. The overview is not a meaningful overview: “Overall, a survey of staff conducted by staff number…” repeats the categories without identifying patterns. Important comparisons are therefore missing, such as the fifth-ranked company having by far the most staff and highest turnover, while the top-ranked company has the lowest turnover. The response addresses the task only minimally because it does not select and highlight key features or explain what the figures show. Add a clear overview and group the most notable contrasts rather than reproducing every row.
Coherence and Cohesion: Band 4.5
The response has a basic sequence: it introduces the table and then describes the companies in ranking order. This makes it possible to locate each company’s figures. However, there is little progression beyond this repeated list, and the overview sentence does not connect the data into a coherent summary. Repeating “The [ordinal] position” for each entry creates a mechanical structure, while missing spaces and punctuation—such as “surveystaff number” and the run-together figures—make relationships between details harder to follow. Use separate, clearly punctuated paragraphs for the overview and comparisons, and organise details by shared patterns (for example, turnover or age profile) rather than repeating the same sentence frame.
Lexical Resource: Band 5.5
You use relevant table vocabulary, including “male:female ratio,” “staff turnover,” and “high income bracket,” and the reader can generally identify the categories being reported. The range is nevertheless limited and repetitive: “percentage of,” “for,” and “position” recur, while phrases such as “staff number for 56” and “male:female ratio figur of 47:53” are not natural ways to describe data. These awkward collocations reduce precision, even though the figures themselves are mostly understandable. Use concise reporting language such as “employed 56 people,” “had a male-to-female ratio of,” and “accounted for 5%.” A wider range of accurate comparison terms would also help you summarise rather than simply list the table.
Grammatical Range and Accuracy: Band 4.5
The response relies almost entirely on short, repeated fragments rather than complete sentences. For example, “The 1st position in surveystaff number for 56…” has no clear main verb, and the overview beginning “Overall, a survey…” is also incomplete. This very limited sentence structure makes the relationships between the company rankings and their statistics unclear. Punctuation and spacing are inconsistent, including missing spaces after commas and doubled commas in the third and fourth entries. Practise forming complete sentences with a subject and verb, such as “The first-ranked company employed 56 people and had a turnover rate of 5%.” Then combine related details using accurate clauses and consistent punctuation.
See this exact question answered at other band scores. The same prompt compared across bands.
Browse more IELTS Writing model answers or get your own writing scored by the same AI examiner.