Band 5.5 IELTS Writing Task 1 Model Answer
Overall Band Score: 5.5 · IELTS Complete Catalyst · 2026-11-18
IELTS Writing Task 1 question
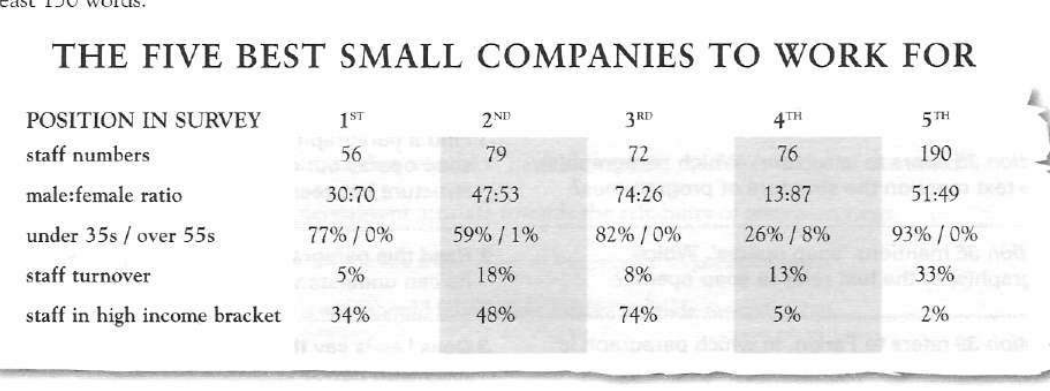
The table below gives information about the five small companies in Britain that came top in a survey of staff conducted by a national newspaper to find out which companies are the best to work for.
Summarise the information by selecting and reporting the main features, and make comparisons where relevant.
THE FIVE BEST SMALL COMPANIES TO WORK FOR
Student answer (Band 5.5)
The table provides data related of five small companies in Britain that came top in a survey of staff conducted by a national newspaper to find out which companies are the best to work for.
Overall, it highlight position in survey, staff numbers increases with position. The male and female ratio changed through out every position. Age group under 35s was always have high percentage than the age group of over 55s. The staff turnover fluctuate within all positions while the staff in high income bracket intially increseased and then suddenly dropped down.
Looking at the details, the staff memners were 56 at 1st position, 79 at 2nd, 72 at 3rd and 76 and 190 at 4th and 5th position respectively. The ratio of male, female was initilly 30:70 and 47:53 at 2nd position, at position third males had highest ratio while females had lowest among all position that is 74:26. Concurrently males had lowest ratio and females had highest ratio at position 4 i-e; 13:87. At 5th position males and females had minor difference 1:2 and that is 51:49. The percentage of empolyees age under 35 years was greater going through all positions i-e; 77%, 59%, 82%, 26%, 93% while the percentage of over 55 years was 0%, 1%, 0%, 8%, 0% respectively.
Subsequently, staff turnerover was 5% at 1st position, 18% at 2nd position which showed increase but it became 8% at 3rd position and again 13% and 33%. The staff in high income bracket showed the upward trend at first three positions that is 34%, 45%, 74%, and suddenlyy drop down to 5%, 2% respectively.
AI examiner evaluation
| Criterion | Band |
|---|---|
| Task Achievement / Task Response | 6.0 |
| Coherence and Cohesion | 6.0 |
| Lexical Resource | 5.5 |
| Grammatical Range and Accuracy | 5.0 |
| Overall | 5.5 |
Task Achievement / Task Response: Band 6.0
You cover the table’s main categories and include many relevant figures, with a clear attempt to summarise overall patterns. The overview notes that the under-35 group is generally larger than the over-55 group and that high-income representation falls sharply after third place. However, some comparisons are unclear or inaccurate: staff numbers do not increase steadily with survey position, since they fall from 79 to 72 and then rise to 76 and 190. The high-income figure for second place is 48%, not 45%. The overview could also identify the first-ranked company’s lowest turnover and the fifth-ranked company’s highest turnover. These omissions and unevenly developed comparisons limit the completeness of the summary.
Coherence and Cohesion: Band 6.0
The response has a recognisable structure: an introduction, an overview, and paragraphs presenting detailed figures. This gives the reader a generally coherent route through the information, and phrases such as “Looking at the details” and “Subsequently” signal a shift in focus. However, the overview combines several patterns in a list-like way, and the detailed paragraph moves between staff numbers, gender and age without always making the relationships easy to follow. Some linking is mechanical, particularly the repeated use of “position” and “and” to connect figures. Grouping related comparisons more deliberately—for example, workforce profile in one paragraph and turnover and income in another—would make progression clearer. Check that references such as “it” have an unmistakable subject.
Lexical Resource: Band 5.5
You use relevant vocabulary for describing data, including “percentage,” “ratio,” “upward trend,” “fluctuate” and “dropped down,” so the main information is usually understandable. There is also some effort to vary wording rather than simply repeat the table labels. However, several spelling and word-choice errors reduce precision, including “memners,” “empolyees,” “turnerover,” “intially” and “suddenlyy.” Some expressions are awkward or imprecise for a formal report, such as “staff numbers increases with position” and “minor difference 1:2.” Use standard forms such as “staff numbers,” “turnover” and “initially,” and describe the 51:49 split as “almost equal.” More accurate collocations would make the account clearer and more natural.
Grammatical Range and Accuracy: Band 5.0
You attempt both simple statements and longer sentences that combine comparisons, such as the sentence beginning “The percentage of employees age under 35 years…”. This shows some range, and the intended meaning is generally recoverable. However, errors in agreement, verb forms and sentence construction occur in several places. For example, “it highlight” needs subject–verb agreement, while “staff numbers increases” also has an agreement error. “Age group under 35s was always have high percentage” combines incompatible verb forms and lacks a clear grammatical structure. The long sentence about staff numbers is also difficult to parse because several figures are joined together. Practise building accurate comparison sentences with a clear subject and verb, and check articles, plurals and punctuation when editing.
See this exact question answered at other band scores. The same prompt compared across bands.
Browse more IELTS Writing model answers or get your own writing scored by the same AI examiner.