Band 5.5 IELTS Writing Task 1 Model Answer
Overall Band Score: 5.5 · Cambridge IELTS 17 · 2026-11-06
IELTS Writing Task 1 question
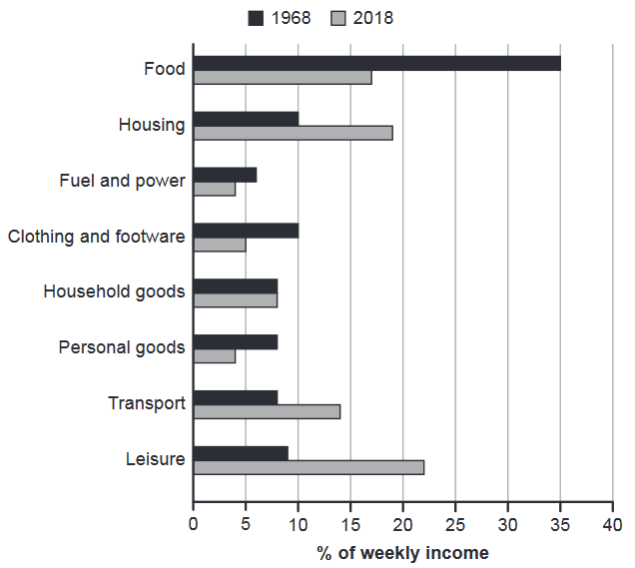
The chart below gives information about how families in one country spent their weekly income in 1968 and in 2018.
Summarise the information by selecting and reporting the main features, and make comparisons where relevant.
1968 and 2018: average weekly spending by families
Student answer (Band 5.5)
The bar chart illustrates the knowledge that how family members tends to spend their money per week during the years 1968 and 2018.
In year 2018, the food accounts for more percentage while the lower values were shown by fuel and power. On the other hand, leisure showed a peak while food and power and personal goods were at lowest proportion with the same number in 2018.
During the year 1968, the food consumed the more money with showing the rate of 35%, which was follwed by housing and clothing and footware having the same figure of 10%. Leisure represents the percentage of 9%. Household goods, personal goods and transport shared the same values that is 8% respectively. Fuel and power used less income of person with the amount of 6%.
Similarly, in the year 2018, the more wages were spent on leisure which is 22% ,then housing at second with the share of 19%.The food demonstrates the expenditure of 17%, followed by clothing and footware 5% , fuel and power and personal goods share the same average of 4%.
So, overal the spending of money on food with the passage of time decreased while on leisure it increased readily.
AI examiner evaluation
| Criterion | Band |
|---|---|
| Task Achievement / Task Response | 5.5 |
| Coherence and Cohesion | 5.0 |
| Lexical Resource | 5.5 |
| Grammatical Range and Accuracy | 5.0 |
| Overall | 5.5 |
Task Achievement / Task Response: Band 5.5
You report many of the chart’s figures accurately, including food at 35% in 1968, leisure at 22% in 2018, and the shared 4% for fuel and power and personal goods in 2018. You also identify the broad shift from food towards leisure. However, the overview is unclear and contains a factual contradiction: it says food accounts for the largest share in 2018, when leisure is highest at 22% and food is 17%. The opening also refers to “family members” rather than families’ weekly spending. Important comparisons are underdeveloped: for example, housing rises from 10% to 19%, while transport increases from 8% to 14%. A clearer, accurate overview and more direct comparisons would strengthen the response.
Coherence and Cohesion: Band 5.0
The response has a recognisable structure: an introduction, comments on 2018, a paragraph about 1968, and a concluding summary. This gives the reader some organisation, and phrases such as “During the year 1968” and “Similarly” signal movement between periods. However, the progression is not consistently clear. The first body paragraph discusses 2018, the next switches to 1968, and the following paragraph returns to 2018, creating repetition rather than a smooth comparison. Some links are also awkward or unclear, particularly “On the other hand” and “So, overal.” Grouping the data by major changes—for instance, declining categories versus rising ones—and using precise linking phrases would make the comparisons easier to follow.
Lexical Resource: Band 5.5
You use some relevant chart vocabulary, including “percentage,” “proportion,” “shared the same values,” and “expenditure,” so the topic is generally understandable. There is also an attempt to vary expressions for spending. However, several choices are inaccurate or unnatural, such as “illustrates the knowledge,” “food consumed the more money,” and “used less income of person.” Repetition of “more” and “share” also limits precision, while spelling errors such as “follwed,” “footware,” and “overal” reduce control. Choose standard collocations for describing figures and changes, such as “accounted for,” “was the largest category,” and “rose from … to …”. More accurate wording would help you express comparisons without ambiguity.
Grammatical Range and Accuracy: Band 5.0
You attempt both simple statements and longer sentences, and the reader can usually identify the categories and figures being discussed. However, control is inconsistent, especially in sentence construction and subject–verb agreement. For example, “how family members tends to spend” has an agreement error and an awkward embedded clause, while “the food accounts for more percentage” does not form a clear comparison. Articles and sentence boundaries are also unreliable, as in “In year 2018” and the run-on punctuation in “19%.The food.” Several sentences rely on similar patterns rather than showing controlled variety. Practise building clear comparative sentences, such as “Food fell from 35% in 1968 to 17% in 2018,” and check agreement, articles, and punctuation.
See this exact question answered at other band scores. The same prompt compared across bands.
Browse more IELTS Writing model answers or get your own writing scored by the same AI examiner.