Band 5.5 IELTS Writing Task 1 Model Answer
Overall Band Score: 5.5 · Cambridge IELTS 17 · 2026-11-06
IELTS Writing Task 1 question
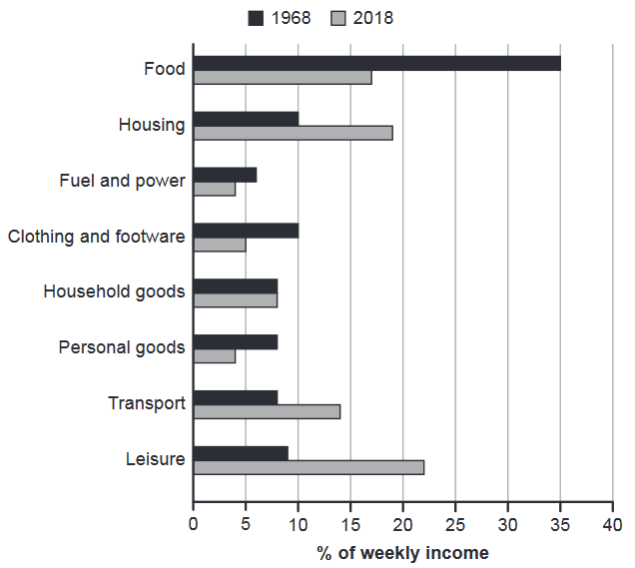
The chart below gives information about how families in one country spent their weekly income in 1968 and in 2018.
Summarise the information by selecting and reporting the main features, and make comparisons where relevant.
1968 and 2018: average weekly spending by families
Student answer (Band 5.5)
The bar chart below represents the information about how the members of family in one country consumed their weekly salary in the period of 1968 and in 2018.
Overall, it can clearly be seen that the average weekly income was spent on food while a small amount comsumed on fuel and power.
To commence with, In 1968 the percentage of food was 35% while, on housing and clothing and footware they utilize 10%.They spent more than 5% on fuel and power and hosehold good they used below to 10% as well as personal goods. They spent more than 5% on transport as well as leisure.
By contrary, In 2018 the highest percentage of average weekly spending by families was on leisure its more than 20% while, they spent less than 20% on housing.They spent more than 15% on food. The percentage of transport was more than 10%. On fuel and personal goods they utilize less than 5.They consumed 5% on clothing and footware while, they used more than 5% on household goods.
AI examiner evaluation
| Criterion | Band |
|---|---|
| Task Achievement / Task Response | 5.0 |
| Coherence and Cohesion | 6.0 |
| Lexical Resource | 5.0 |
| Grammatical Range and Accuracy | 5.0 |
| Overall | 5.5 |
Task Achievement / Task Response: Band 5.0
You identify several important features, including the sharp fall in food spending from 35% and the prominence of leisure in 2018. However, the overview is unclear and partly inaccurate: food was the largest category in 1968, but leisure—not food—was largest in 2018. The statement that spending was “on food” overall misses this change. Some comparisons are too vague to show the data accurately, such as “more than 5%” for transport and leisure in 1968, when their values were about 8% and 9%. You also omit the rise in housing and transport and the unchanged household-goods figure. To strengthen the response, give a clear overview of the main shifts and select a few precise comparisons.
Coherence and Cohesion: Band 6.0
The response has a recognisable structure: an introduction, an overview, and separate paragraphs for the two years. This makes the information reasonably easy to follow. The year-by-year organisation is clear, but the comparisons between years are limited, so the progression feels more like two lists than a connected account of change. Linking phrases such as “To commence with” and “By contrary” are also awkward or mechanical, and repeated use of “They spent” does little to connect related figures. Grouping categories by whether they rose, fell, or stayed similar would create a clearer progression. Use straightforward transitions such as “In contrast” and “Meanwhile,” and make references to the spending categories explicit.
Lexical Resource: Band 5.0
You use relevant chart vocabulary, including “percentage,” “average weekly spending,” and “highest,” and the reader can generally identify the categories being discussed. However, the range is limited and several word choices or collocations are inaccurate, which makes parts of the report less clear. For example, families do not “consume their weekly salary”; they spend or allocate their weekly income. “The percentage of food” is also less precise than “the proportion spent on food,” while “they utilize” is unnatural for describing expenditure. Spelling errors such as “comsumed,” “hosehold,” and “footware” further reduce accuracy. Aim for precise spending-related vocabulary and check category names carefully.
Grammatical Range and Accuracy: Band 5.0
You attempt both simple statements and longer sentences with contrast, but the range is limited and complex constructions are often faulty. For example, “Overall, it can clearly be seen that the average weekly income was spent on food while a small amount comsumed on fuel and power” lacks a clear grammatical subject in its second clause. In “the highest percentage … was on leisure its more than 20%,” two clauses are joined without appropriate punctuation or a linking structure. There are also inconsistent capitalisation after commas and missing spaces after full stops. Build accurate sentences around a clear subject and verb, and use full stops or conjunctions to separate complete ideas.
See this exact question answered at other band scores. The same prompt compared across bands.
Browse more IELTS Writing model answers or get your own writing scored by the same AI examiner.