Band 6.5 IELTS Writing Task 1 Model Answer
Overall Band Score: 6.5 · Cambridge IELTS 17 · 2026-11-06
IELTS Writing Task 1 question
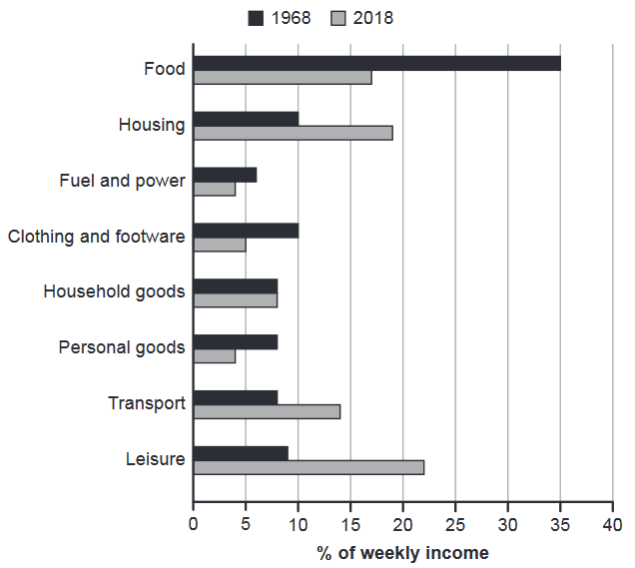
The chart below gives information about how families in one country spent their weekly income in 1968 and in 2018.
Summarise the information by selecting and reporting the main features, and make comparisons where relevant.
1968 and 2018: average weekly spending by families
Student answer (Band 6.5)
The bar chart provides information about households weekly expenditure on different categories in one country from 1968 and 2018.
Overall, the highest amount of money was spent on food in 1968. And the majority of people spent money on leisure activities in 2018. Moreover, expenses on household goods remained relatively stable over the period.
Looking at the details, in 1968, a huge portion of their income was allocated in food accounting for 35%, however, this figure decreased in 2018 at almost 17%. Housing stood at 10% before increasing to reach 19% in 2018. Furthermore, spending on fuel and power remained almost same as 6% in 1968 and 4% in 2018. Additionally, a significant reduction was seen in clothing and footwear, which fell from 10% to 5% by the end of the timeframe.
In addition, spending on household goods remained relatively stable in both years at almost 8%. Moreover, money invested on personal goods reached from 8% to 4% in 2018. Transport showed a large amount of expenditure in 2018 at 14%, whereas, accounted for 8% in 1968. Spending on leisure activities was the second highest category in 2018 represents almost 23% in 2018 compared with 9% in 1968.
AI examiner evaluation
| Criterion | Band |
|---|---|
| Task Achievement / Task Response | 7.0 |
| Coherence and Cohesion | 6.5 |
| Lexical Resource | 6.5 |
| Grammatical Range and Accuracy | 6.0 |
| Overall | 6.5 |
Task Achievement / Task Response: Band 7.0
The response selects the main trends and supports them with relevant figures: food falls from 35% to about 17%, housing rises from 10% to 19%, and household goods stays at 8%. The overview also identifies food as the largest category in 1968 and leisure as the largest in 2018, although “the majority of people” is an overstatement: leisure accounts for about 22%, not most spending. The comparisons cover all eight categories, and the figures are generally consistent with the chart. To strengthen the report further, make the overview more precise by highlighting the broad shift away from food and towards leisure, housing and transport, rather than describing leisure spending as a majority.
Coherence and Cohesion: Band 6.5
The response has a clear overall structure: an introduction, an overview and a detailed comparison of the categories. The information is generally easy to follow, and linking expressions such as “Furthermore,” “In addition” and “Moreover” help connect points. However, these transitions are used quite mechanically, and several consecutive sentences begin with similar additive markers. The final paragraph also moves through categories without grouping the main increases and decreases, so the progression feels somewhat list-like. Grouping categories by trend—for example, rising expenditure versus falling or stable expenditure—and using fewer, more purposeful connectors would make the organisation more flexible and the comparisons easier to absorb.
Lexical Resource: Band 6.5
There is an adequate range of vocabulary for describing the chart, including “allocated,” “decreased,” “remained relatively stable” and “accounted for.” These choices communicate the main comparisons, and the writer attempts some less common phrasing. However, several expressions are imprecise or unnatural for expenditure data: “a huge portion,” “money invested on personal goods,” and “reached from 8% to 4%.” “The majority of people” also misrepresents a spending share as a proportion of people. There is a spelling error in “footware,” and “expenses on household goods” is less natural than “spending on household goods.” More accurate collocations and consistent use of “share/proportion of weekly income” would improve precision.
Grammatical Range and Accuracy: Band 6.0
The response uses a mix of simple and more complex sentence forms, including clauses with “which” and contrasts introduced by “however” and “whereas.” Most meanings remain clear, but some grammatical errors recur. The opening has an incorrect time construction (“from 1968 and 2018”), and “the highest amount of money was spent” is followed by the sentence fragment “And the majority…” The phrase “remained almost same” is missing an article, while “spending on leisure activities was the second highest category … represents” combines incompatible verb structures. Punctuation around “however” and “whereas” is also not consistently controlled. Check sentence boundaries and ensure each clause has a complete, correctly formed verb structure.
See this exact question answered at other band scores. The same prompt compared across bands.
Browse more IELTS Writing model answers or get your own writing scored by the same AI examiner.