Band 5.5 IELTS Writing Task 1 Model Answer
Overall Band Score: 5.5 · Cambridge IELTS 17 · 2026-11-08
IELTS Writing Task 1 question
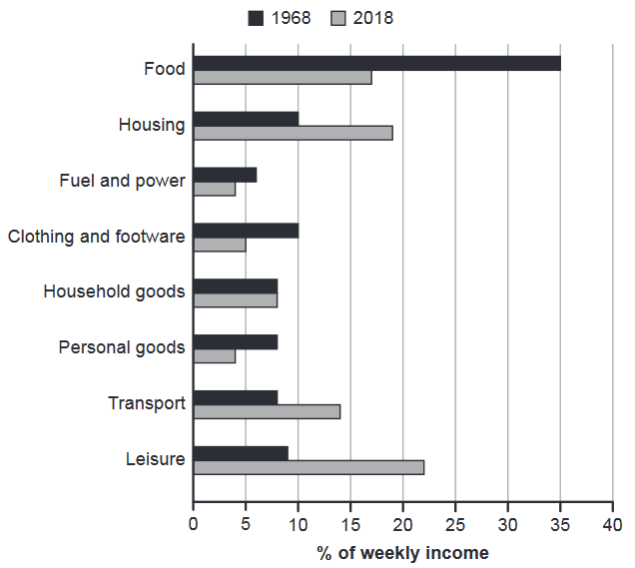
The chart below gives information about how families in one country spent their weekly income in 1968 and in 2018.
Summarise the information by selecting and reporting the main features, and make comparisons where relevant.
1968 and 2018: average weekly spending by families
Student answer (Band 5.5)
The bar chart depicts the data related to families allocated their weekly money on different things in 1968 and 2018.
Overall, it can be observe that the most individuals prefer to spent their income on food as compared to other categories in both years.
In 1968 people spent nearly 10% of their income on leisure activitie. While, more than 20% amount used in 2018 in same activity which was the second highest proportion comperetively others. In 1968, 8% weekly income allocated on personal good, which was the twice than as it was in 2018. Individuals, spent similar amount of money on hosehold goods around 8% in both years.
In 1968 , food was the highest percentage among the others, which was 35%. However, in 1968 and 2018 people spent 10% and around 15% on housing, respectively. Apart from this, fuel and power seen as the lowest things which people weekly spent money with an average 5% in both years.
AI examiner evaluation
| Criterion | Band |
|---|---|
| Task Achievement / Task Response | 5.0 |
| Coherence and Cohesion | 5.5 |
| Lexical Resource | 5.5 |
| Grammatical Range and Accuracy | 5.0 |
| Overall | 5.5 |
Task Achievement / Task Response: Band 5.0
You identify several relevant comparisons, including the sharp fall in food spending from 35% in 1968 and the rise in leisure spending to over 20% in 2018. You also note that household-goods spending stayed around 8%. However, the overview is inaccurate: food was not the largest category in both years, since leisure was highest in 2018 at about 22%, compared with food at 17%. The claim that fuel and power was the lowest in both years is also incorrect; clothing and personal goods were lower in 2018. Housing is reported as around 15% in 2018, rather than approximately 19%, and transport is omitted. The response therefore selects some key features but covers the chart only partially and leaves important comparisons unclear.
Coherence and Cohesion: Band 5.5
The response has a basic paragraph structure, moving from an introduction and overview to details, and it groups some comparisons by category. This gives the reader a general sense of the chart. However, progression is uneven: the overview says food led in both years, while the later paragraph gives figures that contradict this. The sequence also shifts between leisure, personal goods, household goods, food, and housing without a clear organising principle, and transport is not discussed. Connectors such as “While” and “Apart from this” do not always create clear relationships between ideas. Organise the details into clearer comparisons—for example, categories that rose versus those that fell—and ensure the overview accurately previews the information that follows.
Lexical Resource: Band 5.5
You use some task-relevant vocabulary, including “proportion,” “allocated,” and “highest percentage,” and the reader can generally identify the categories being discussed. However, the range is limited and several word choices or collocations are unnatural, such as “families allocated their weekly money,” “spent their income on leisure activitie,” and “lowest things.” Spelling errors in “comperetively,” “hosehold,” and “activitie” also reduce precision. Some expressions are vague, including “same activity” and “around 15%,” where a more exact comparison would help. Aim for natural chart-reporting phrases such as “accounted for,” “the share spent on,” and “rose to,” while checking spelling and using category names accurately.
Grammatical Range and Accuracy: Band 5.0
You attempt a few complex structures, including “While, more than 20% amount used in 2018…” and “However, in 1968 and 2018…,” but control is inconsistent. Errors occur in verb forms and agreement: “it can be observe” should be “it can be observed,” and “individuals prefer to spent” should be “individuals preferred to spend.” Several sentences lack a complete grammatical structure, notably “While, more than 20% amount used in 2018…” and “fuel and power seen as the lowest things.” Articles, prepositions, and punctuation are also unreliable, as in “on same activity” and the space before the comma in “1968 ,”. Use complete sentences with a clear subject and verb, and check tense and agreement throughout.
See this exact question answered at other band scores. The same prompt compared across bands.
Browse more IELTS Writing model answers or get your own writing scored by the same AI examiner.