Band 5.5 IELTS Writing Task 1 Model Answer
Overall Band Score: 5.5 · Cambridge IELTS 17 · 2026-11-08
IELTS Writing Task 1 question
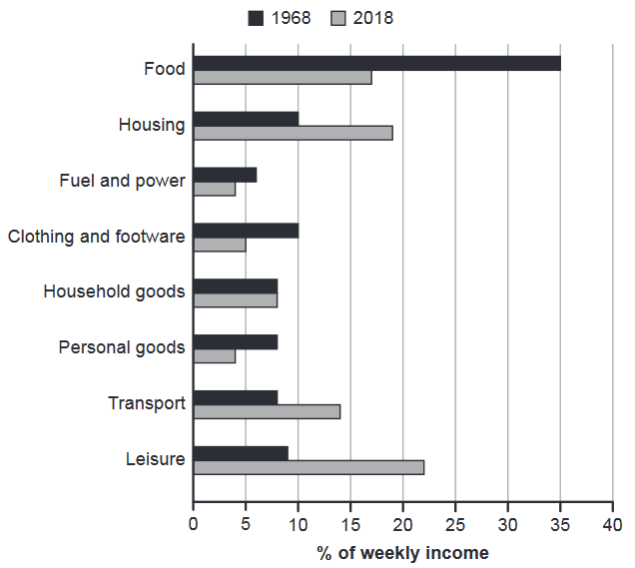
The chart below gives information about how families in one country spent their weekly income in 1968 and in 2018.
Summarise the information by selecting and reporting the main features, and make comparisons where relevant.
1968 and 2018: average weekly spending by families
Student answer (Band 5.5)
The bar graph illustrates the percentage of weekly income spent by families in one country for the years 1968 and 2018.
Overall, it is clear that families prefered to spend more income on food in the beginning. Later on it shifted to leisure. Eventhough after 5decades amount spent on household goods remained same.
In 1968, food recorded with 35% it was highest proportion in the 5decades, while in 2018 it was declined to around 17%. Household goods, personal goods and transport recorded same in 1968 accounted for around 8%. personal goods and transport accounted to 4 and 14% in 2018.
Families spent on Fuel and power and personal goods were the to least in 1968 around 4%. In 2018 families spent highest on leisure around 21% and next on housing by 19%. Clothing and footwear and housing proportions recorded same in 1968 with 10%.
AI examiner evaluation
| Criterion | Band |
|---|---|
| Task Achievement / Task Response | 5.5 |
| Coherence and Cohesion | 5.5 |
| Lexical Resource | 5.5 |
| Grammatical Range and Accuracy | 5.0 |
| Overall | 5.5 |
Task Achievement / Task Response: Band 5.5
You identify the main shift from food being the largest category in 1968 to leisure in 2018, and correctly note that household-goods spending stayed at about 8%. Several figures are also reported accurately, including food at 35% and 17%, and housing at 10% and 19%. However, coverage is incomplete and some details are inaccurate: fuel and power was about 6% in 1968, not 4%, and the lowest categories in that year were around 6%, rather than 4%. You also omit the 2018 figures for fuel and power and household goods. The response is 144 words, below the required 150, and some comparisons are left unclear. Include the missing categories and a fuller overview of the main changes.
Coherence and Cohesion: Band 5.5
The response has a recognisable structure, with an introduction, an overview and two detail paragraphs. The overview gives the reader a useful central comparison, and the final paragraph adds information about housing and leisure. However, progression within the detail paragraphs is uneven: categories from different years are mixed together, and the reader must work to connect some figures to their categories. For example, “personal goods and transport accounted to 4 and 14%” does not clearly distinguish which figure belongs to which category. Linking phrases such as “while” and “in 2018” help, but connections are sometimes mechanical or unclear. Group the figures by year or by categories that changed similarly, and use explicit comparisons to make the sequence easier to follow.
Lexical Resource: Band 5.5
You use relevant chart vocabulary, including “percentage,” “proportion,” “accounted for,” and “remained same,” so the topic is generally clear. There is some repetition of “spent” and “accounted,” and several word-choice or collocation problems make parts less natural, such as “families prefered to spend” and “food recorded with 35%.” Spelling errors include “prefered,” “Eventhough,” and “footwear” (the chart label is “footwear,” though the response also uses “footware” in the task wording context). Aim for precise reporting verbs and standard spelling. For example, say that a category “accounted for” a share or that spending “fell to” a figure, rather than saying it “recorded with” that percentage.
Grammatical Range and Accuracy: Band 5.0
You attempt a mixture of simple and more complex sentences, including a contrast with “while” and a time clause beginning “Even though.” However, sentence control is inconsistent, and some structures are incomplete or difficult to interpret. “Overall, it is clear that families prefered to spend more income on food in the beginning. Later on it shifted to leisure” leaves the subject of “it” unclear. In “In 1968, food recorded with 35% it was highest proportion,” two clauses are joined without suitable punctuation, and the article is missing before “highest proportion.” The phrase “Families spent on Fuel and power and personal goods were…” also has a faulty sentence structure. Practise complete clauses, clear subjects, articles, and punctuation, then check each sentence for a clear relationship between its parts.
See this exact question answered at other band scores. The same prompt compared across bands.
Browse more IELTS Writing model answers or get your own writing scored by the same AI examiner.