Band 4.0 IELTS Writing Task 1 Model Answer
Overall Band Score: 4.0 · Cambridge IELTS 17 · 2026-11-08
IELTS Writing Task 1 question
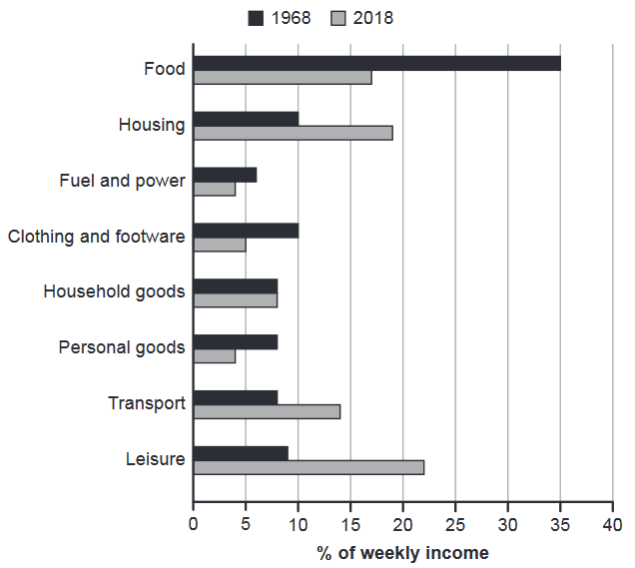
The chart below gives information about how families in one country spent their weekly income in 1968 and in 2018.
Summarise the information by selecting and reporting the main features, and make comparisons where relevant.
1968 and 2018: average weekly spending by families
Student answer (Band 4.0)
The bar graph illustrates the amount of money families spend from their weekly income in a country in the year 1968 and 2018.
It is evident that the highest amount of money was spent on food by the people in 1968, by contrast in 2018 people invested in leisure more than other 7 sectors
AI examiner evaluation
| Criterion | Band |
|---|---|
| Task Achievement / Task Response | 3.0 |
| Coherence and Cohesion | 4.5 |
| Lexical Resource | 4.5 |
| Grammatical Range and Accuracy | 4.5 |
| Overall | 4.0 |
Task Achievement / Task Response: Band 3.0
You identify two important headline features: food was the largest category in 1968, while leisure was the largest in 2018. However, the response does not summarise the chart sufficiently: it gives no figures, omits the other categories and provides no comparisons beyond those two rankings. The phrase “more than other 7 sectors” is also imprecise; it would be clearer to say leisure accounted for the highest share among the eight categories. The required minimum length is not met, leaving the report far too brief to select and explain the main features. Add an overview and several accurate comparisons, such as food falling from about 35% to 17% and leisure rising from about 9% to 22%.
Coherence and Cohesion: Band 4.5
The response has a basic, understandable order: it introduces the bar chart and then gives a headline comparison between the two years. The linking phrase “by contrast” signals a change from the 1968 pattern to the 2018 pattern, which helps the reader follow the central point. However, the report is too short to show a developed progression of information, and the second sentence joins two complete ideas with only a comma after “1968,” making the connection awkward. Use separate overview and detail paragraphs, and organise comparisons by category or by increases and decreases. Clear links such as “whereas,” “meanwhile,” and “in comparison” can help connect the additional data.
Lexical Resource: Band 4.5
You use relevant chart vocabulary, including “bar graph,” “weekly income,” and “spent,” and the wording is generally understandable. There is some attempt to vary expression with “by contrast” and “invested in leisure.” However, “invested in leisure” is not a natural description of household expenditure in this context; “spent on leisure” or “allocated to leisure” is more precise. “Amount of money” is also less suitable than “proportion” or “share,” because the chart reports percentages of income rather than cash amounts. The phrase “other 7 sectors” is understandable but informal and imprecise. Use accurate terms for percentages and spending categories, and include vocabulary for describing rises, falls and stable figures.
Grammatical Range and Accuracy: Band 4.5
The response uses a simple present-tense introduction and a past-tense comparison, and the main meaning can be understood. The sentence beginning “It is evident” also shows an attempt to use a more complex structure. However, the range is very limited, with only two sentences and little evidence of varied sentence patterns. In the second sentence, “by contrast” is followed by a comma between two independent clauses; use a full stop or semicolon, or restructure the sentence with “whereas.” The phrase “more than other 7 sectors” would be grammatically clearer as “more than in the other seven sectors.” Practise combining accurate comparative clauses with figures, while checking punctuation and sentence boundaries.
See this exact question answered at other band scores. The same prompt compared across bands.
Browse more IELTS Writing model answers or get your own writing scored by the same AI examiner.