Band 4.5 IELTS Writing Task 1 Model Answer
Overall Band Score: 4.5 · IELTS Complete Catalyst · 2026-11-06
IELTS Writing Task 1 question
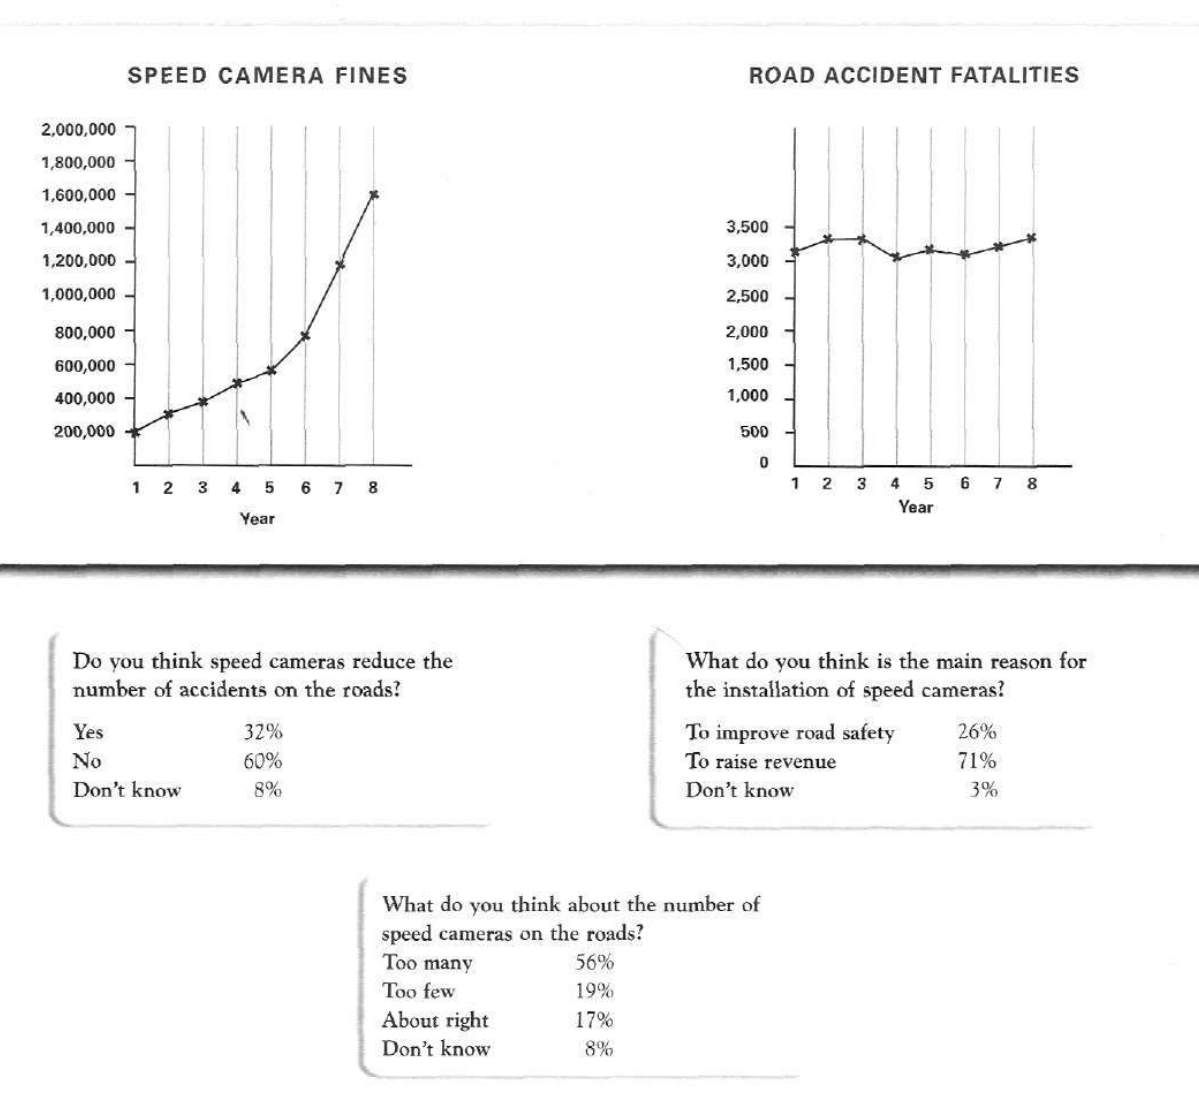
The graphs below show the number of drivers in Britain who have been caught driving too fast by speed cameras placed on roads, and the number of people killed in road accidents, over an eight-year period since the introduction of speed cameras. The tables show the results of a survey on people's opinions on speed cameras.
Write a report for a university lecturer describing the information below.
SPEED CAMERA FINES and ROAD ACCIDENT FATALITIES
Student answer (Band 4.5)
The line graph displays the number of drivers have been caught driving too fast by speed cameras placed on the roads and the number of people killed in road accidets , over an eight year period since the introduction if speed cameras in britian.
At first, in first year the fine was [redacted phone] it gradually increses and reached to the peak in eighth year to [redacted phone]. I think cameras don't reduces the number of accidents on the road because cameras only record the footage not stop the accidents and there are only 32% people who agrees that camera reduces the road accidents.
second, in year 1,road accident fatalities was around 3100 but it increases to 3500 in eigth year by the increase of 400 per year. I think the main reason for installing speed cameras are to raise revenue not to improve road safety. If they installed cameras then they have to increase number of cameras on the road, it can monitors the theft. 56% people agreed to the number of speed cameras on road should be installed and 8% don't want to give their opnion.
overall,I completly agrred that by installing speed cameeras we can reduces the number of road acidnts by fining a handsome amount of fines to the drivers who drive fast at the busy road also.
AI examiner evaluation
| Criterion | Band |
|---|---|
| Task Achievement / Task Response | 4.0 |
| Coherence and Cohesion | 4.0 |
| Lexical Resource | 5.0 |
| Grammatical Range and Accuracy | 4.5 |
| Overall | 4.5 |
Task Achievement / Task Response: Band 4.0
You identify the two charts and refer to the survey, but the report only responds minimally to the visual information and does not provide a clear, accurate overview. The fines rise from 200,000 to 1.6 million, which you describe correctly, but the fatalities do not increase steadily to 3,500: they fluctuate around 3,100–3,350, ending at about 3,350. The survey figures are also partly misrepresented: 56% said there were too many cameras, not that cameras should be installed, and the claim about monitoring theft is not shown in the data. Your personal opinions about whether cameras work and how they operate replace objective description. Focus on the main trends and report the survey results accurately, without adding unsupported explanations.
Coherence and Cohesion: Band 4.0
There is a basic attempt to organise the response, with an opening sentence, references to the first and final years, and a concluding statement. However, the information is not arranged coherently: the discussion moves from fines to personal opinion, then fatalities, survey results, theft, and another personal opinion. Connect related information in a clear sequence—for example, describe both chart trends first, then summarise the three survey findings. Linking words such as “At first” and “second” do not establish clear relationships, and the conclusion contradicts the earlier claim that cameras do not reduce accidents. Use paragraphing and straightforward transitions to make the report’s progression easier to follow.
Lexical Resource: Band 5.0
Your vocabulary is basic but includes some task-relevant terms, such as “speed cameras,” “road accident fatalities,” “peak,” and “raise revenue.” This gives you enough language to communicate the general subject, although repetition and inaccurate word choices sometimes make the meaning unclear. For instance, “the fine was 200000” confuses the number of fines or drivers caught with the amount of an individual fine, while “monitors the theft” is not an appropriate description of the chart. Spelling errors such as “accidets,” “britian,” and “opnion” are also noticeable. Build a more precise range for describing data, including “the number of drivers fined,” “fluctuated,” and “accounted for.”
Grammatical Range and Accuracy: Band 4.5
The response attempts both simple and longer sentences, but grammatical errors are frequent and sometimes make relationships between ideas difficult to understand. Examples include “the number of drivers have been caught,” “cameras don't reduces,” and “there are only 32% people who agrees”; these show problems with agreement and verb forms. Articles and sentence construction are also weak in phrases such as “in first year” and “by the increase of 400 per year.” Punctuation is inconsistent, with missing spaces after commas and run-on sentences joining several claims. Practise accurate simple sentences for each data point, then combine them using controlled clauses—for example, “Fatalities fluctuated, ending at approximately 3,350 in year eight.”
See this exact question answered at other band scores. The same prompt compared across bands.
Browse more IELTS Writing model answers or get your own writing scored by the same AI examiner.