Band 5.0 IELTS Writing Task 1 Model Answer
Overall Band Score: 5.0 · IELTS Complete Catalyst · 2026-11-07
IELTS Writing Task 1 question
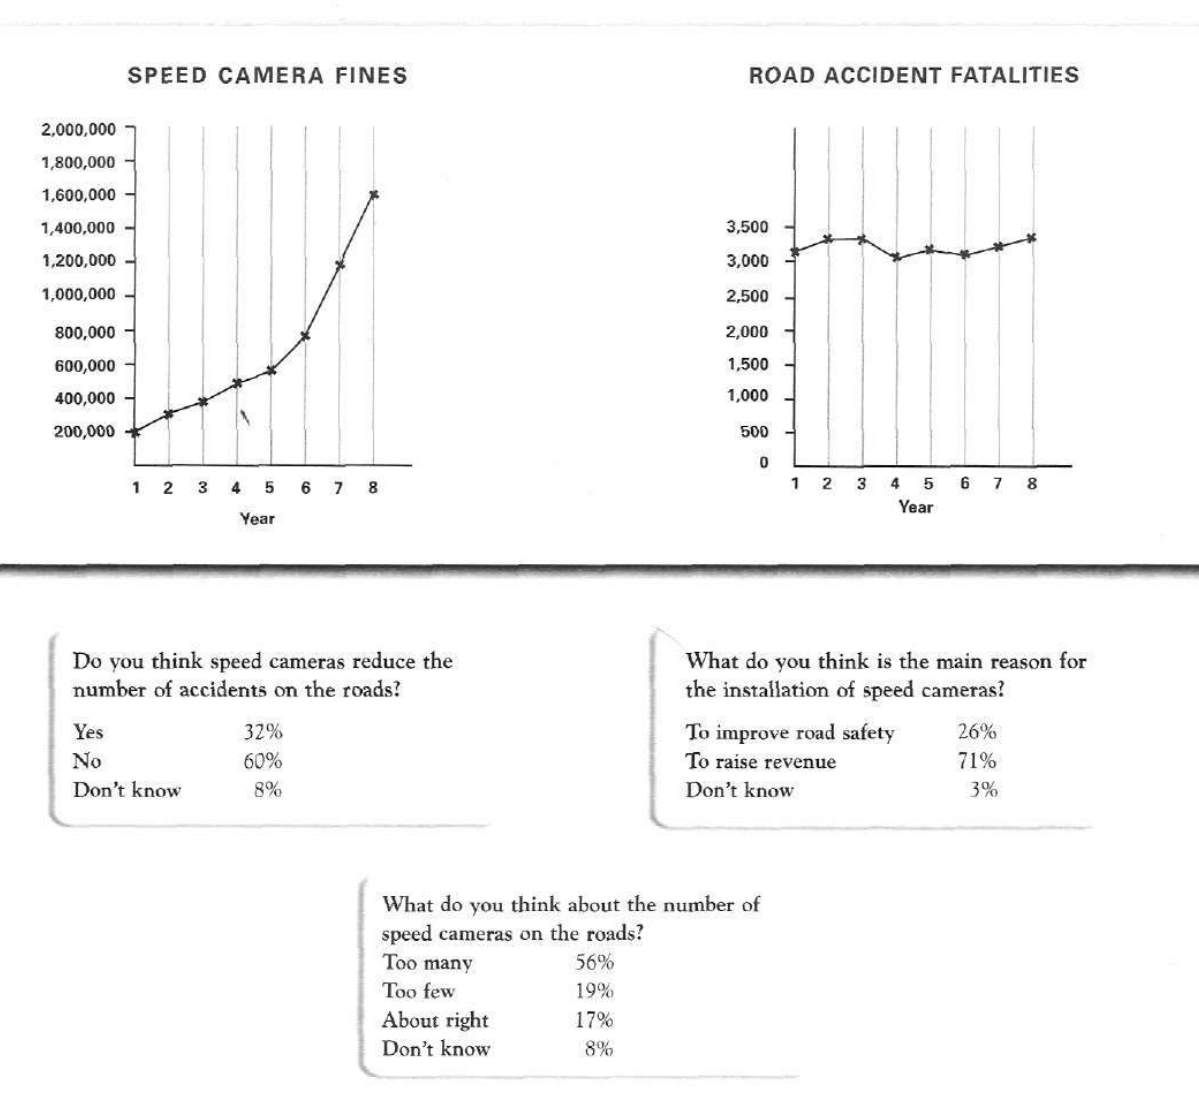
The graphs below show the number of drivers in Britain who have been caught driving too fast by speed cameras placed on roads, and the number of people killed in road accidents, over an eight-year period since the introduction of speed cameras. The tables show the results of a survey on people's opinions on speed cameras.
Write a report for a university lecturer describing the information below.
SPEED CAMERA FINES and ROAD ACCIDENT FATALITIES
Student answer (Band 5.0)
The bar graph illustrate the number of drivers, who have been caught driving to fast by cameras placed on road, and how many people killed in road accidents in britain, over eight year period .
Looking from an overall perspective, it is crystal clear that, the speed camera fine rapidily increase day by day. And road accident fatalitis rise up and fall.
Reporting the data in detail, the speed fines was only [redacted phone], for first year and 2 year it become double. From 3 year to fourth it rise up [redacted phone] approximatly but in 5 year it was increased by 80 lakh and in 6 year it again increase up to 1 crore 20 lakh. From 7 year to last it touch 1 crore 65 lakh. It was increase continuesly.
Glancing at the remaining description,in road accident, in first 2 years it rise up 3000 to 3400 but in 3- 4 year it fall. From 5 to 6 year it had 33 hundred approx but in last 2 years it increase up to 3500.
AI examiner evaluation
| Criterion | Band |
|---|---|
| Task Achievement / Task Response | 3.5 |
| Coherence and Cohesion | 5.5 |
| Lexical Resource | 5.0 |
| Grammatical Range and Accuracy | 5.0 |
| Overall | 5.0 |
Task Achievement / Task Response: Band 3.5
The response identifies the two chart topics and gives a brief overview that fines rise while fatalities fluctuate, so it does recognise the broad subject. However, it omits all three survey tables, a major part of the task, and several figures for the charts are substantially inaccurate. For example, fines rise from about 200,000 to 1.6 million, not to “1 crore 65 lakh”; the increase from year 3 to year 4 is about 120,000, not 1,700,000. Fatalities are around 3,100–3,350, rather than the stated 3,400 in year 2 and 3,500 at the end. To improve, cover the survey findings and select a few accurate comparisons from each visual.
Coherence and Cohesion: Band 5.5
The response has a recognisable structure: an introduction, an overview, and separate paragraphs for the two chart series. Phrases such as “Looking from an overall perspective” and “Reporting the data in detail” signal the stages of the report. However, progression within the detail paragraphs is weakened by unclear time references, including “for first year and 2 year” and “From 3 year to fourth,” and the sequence of figures is difficult to follow. The final paragraph also ends without a concluding summary, while the survey information is not integrated at all. Use clearer chronological comparisons, such as “from year 1 to year 2,” and organise the report into chart trends and survey results, with linking language that makes each comparison explicit.
Lexical Resource: Band 5.0
The writer attempts some task-relevant vocabulary, including “overall perspective,” “fatalities,” “rise,” and “fall,” and uses different expressions to introduce details. However, the range is limited and several choices or spellings make the report less precise: “speed camera fine” is not a natural label for the number of drivers caught, “touch” is informal for reaching a figure, and “rapidily,” “fatalitis,” and “continuesly” are misspelled. The use of “lakh” also makes the figures harder to compare with the chart’s numerical scale. Aim for standard chart language and accurate forms, such as “the number of fines,” “fluctuated,” and “reached approximately 1.6 million.”
Grammatical Range and Accuracy: Band 5.0
The response uses both simple statements and some longer structures, and the reader can generally identify the intended topic. However, frequent errors in agreement, articles, verb forms, and sentence construction reduce clarity. For example, “The bar graph illustrate” needs subject–verb agreement, while “the speed fines was” and “it become double” have incorrect verb forms. The opening sentence also has an unnecessary comma in “drivers, who” and lacks articles in “on road” and “over eight year period.” Punctuation is inconsistent, including spaces before full stops and commas after introductory phrases. Practise accurate past-tense reporting and build sentences around clear subjects and verbs, for example: “The number of fines rose from 200,000 in year 1 to 300,000 in year 2.”
See this exact question answered at other band scores. The same prompt compared across bands.
Browse more IELTS Writing model answers or get your own writing scored by the same AI examiner.