Band 5.5 IELTS Writing Task 1 Model Answer
Overall Band Score: 5.5 · IELTS Complete Catalyst · 2026-11-08
IELTS Writing Task 1 question
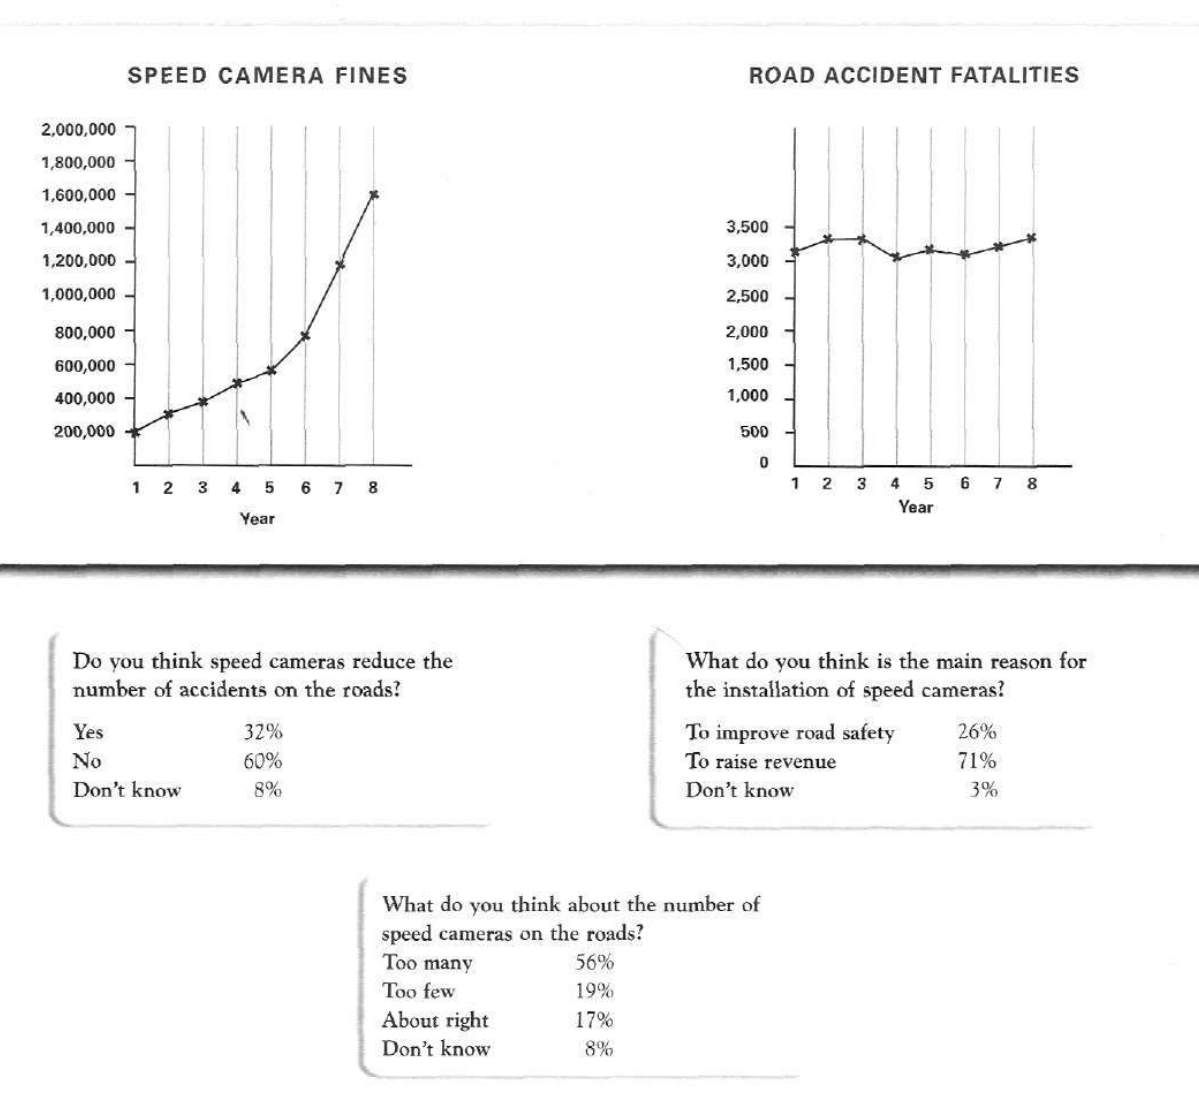
The graphs below show the number of drivers in Britain who have been caught driving too fast by speed cameras placed on roads, and the number of people killed in road accidents, over an eight-year period since the introduction of speed cameras. The tables show the results of a survey on people's opinions on speed cameras.
Write a report for a university lecturer describing the information below.
SPEED CAMERA FINES and ROAD ACCIDENT FATALITIES
Student answer (Band 5.5)
The graph chart illustrates the ammount of drivers in Britain who have been caught driving over speed limits by speed cameras located on roads, and the number of indivisuals killed in road accidents, over an eight-year timeline.
Overall it can be seen that the numbvers of speed cameras has increased significantly but the road accident fatalities remains almost same throughout these eight-year period. Past eight years the number of speed cameras rises about eight times but theres no enormous change in the number of people lost their life in road accident.
Looking at the road accident fatalities from last 8 years the numbers remain in the range of three thousands to three thousand and five hundreds. So, in contrast maximum time the number was high only in the forth year the number sets the lowest.
The survay shows that the citizens of Britain isn't much happy about the speed cameras. They are more likey to fustraite about such ammount of speed cameras. More than half of the people think speed cameras can't reduce the number of accidents. And about one therid of the people think the main reason of these speed cameras are for revenew. People complain that the number of spped cams are way more that needed.
AI examiner evaluation
| Criterion | Band |
|---|---|
| Task Achievement / Task Response | 6.0 |
| Coherence and Cohesion | 6.0 |
| Lexical Resource | 5.0 |
| Grammatical Range and Accuracy | 5.0 |
| Overall | 5.5 |
Task Achievement / Task Response: Band 6.0
You cover the main components of the task: the sharp rise in fines, the broadly stable fatality figures, and several survey findings. Your overview correctly contrasts the increase in fines with little change in deaths. However, some details are inaccurate or unclear: fines rose from 200,000 to 1.6 million, about eightfold, but these are fines rather than the “number of speed cameras.” You also identify the fourth year as the lowest point for fatalities, whereas the lowest figure is around year 6; the peak is in year 8. The survey summary includes the majority who think cameras do not reduce accidents and that they are mainly for revenue, but the claim that people are “not much happy” is not directly established by the results. More precise selection and reporting of figures would strengthen coverage.
Coherence and Cohesion: Band 6.0
The response has a recognisable structure, moving from an introduction and overview to chart details and then survey results. This makes the information generally easy to follow. The contrast introduced by “but” and “in contrast” helps signal the relationship between the two graph trends. However, the paragraph about fatalities is difficult to interpret: “maximum time the number was high only in the forth year” does not clearly explain the pattern, and it conflicts with the chart. The survey paragraph also moves quickly between opinions without clearly separating the three questions. Use clearer topic sentences and link each survey result to its question; for example, report the accident-reduction responses, then the perceived purpose, then views on camera numbers.
Lexical Resource: Band 5.0
You use some relevant task vocabulary, including “road accident fatalities,” “speed limits,” “revenue,” and “reduce the number of accidents.” However, spelling errors are noticeable, such as “ammount,” “indivisuals,” “numbvers,” “survay,” and “fustraite,” and these reduce the accuracy and polish of the report. Some word choices are also imprecise: “number of speed cameras” mislabels the fines data, while “people lost their life” and “way more that needed” are informal or awkward for an academic report. Aim for accurate chart terminology and neutral reporting language. A broader set of precise verbs and phrases for describing trends and proportions would also help you express the data more clearly.
Grammatical Range and Accuracy: Band 5.0
You attempt both simple and more complex sentences, including a contrast with “but” and a clause beginning “that the citizens of Britain…”. Meaning is usually recoverable, but some grammatical errors affect clarity. For example, “the road accident fatalities remains almost same” has subject–verb agreement and article problems; “these eight-year period” should use a plural noun and determiner; and “the citizens of Britain isn't” has disagreement between the plural subject and verb. The sentence about the fourth year is also structurally unclear. Practise accurate agreement, articles, and plural forms, and check that each sentence has a clear subject and verb. More controlled complex sentences would let you compare trends without sacrificing accuracy.
See this exact question answered at other band scores. The same prompt compared across bands.
Browse more IELTS Writing model answers or get your own writing scored by the same AI examiner.