Band 5.0 IELTS Writing Task 1 Model Answer
Overall Band Score: 5.0 · IELTS Complete Catalyst · 2026-11-08
IELTS Writing Task 1 question
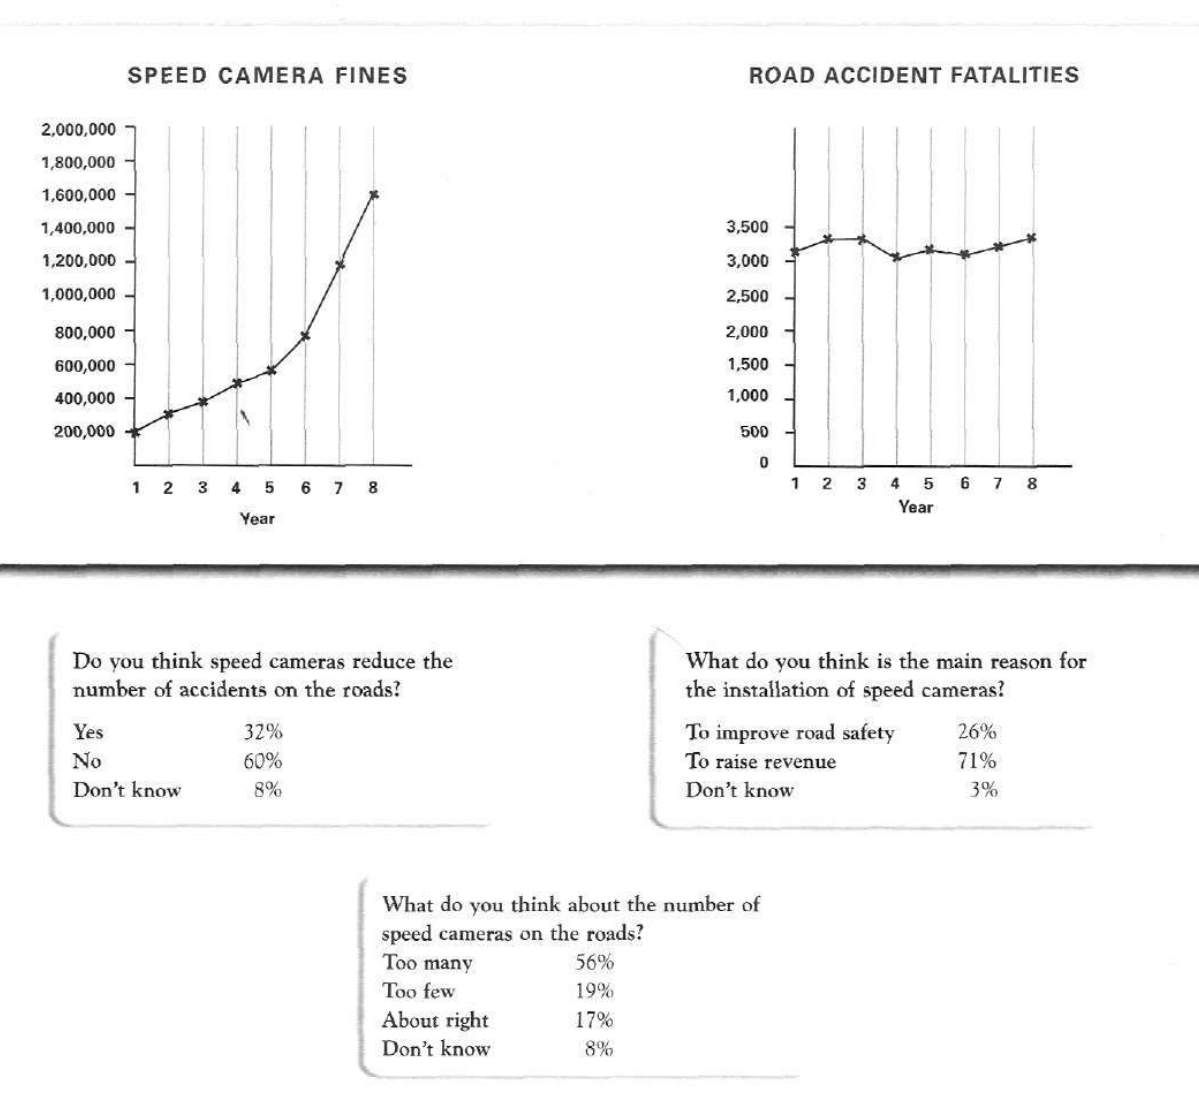
The graphs below show the number of drivers in Britain who have been caught driving too fast by speed cameras placed on roads, and the number of people killed in road accidents, over an eight-year period since the introduction of speed cameras. The tables show the results of a survey on people's opinions on speed cameras.
Write a report for a university lecturer describing the information below.
SPEED CAMERA FINES and ROAD ACCIDENT FATALITIES
Student answer (Band 5.0)
The graph belows show the number of drivers in britain that an past eight years structure about road accidents facilities and speed cameras fines.
On one hand the driver community peoples getted the camera speed fines started in first year from 200,000 which is overly exaggerate to 1600,000 with in eight years.
On the other hand there is a road accident facilities for drivers community for the purpose of circumduct the accident ratio which is in first year 3000 and partially go down in fourth year after that climb over to the last year partially from first year.
overall the speed cameras reduce the number of accident on the roads there is opinion about citizens No ratio is more high then yes ratio and don't know ratio is quite low, Moreover the main reason for the installation of speed cameras the ratio of raise revenue is more high from improve road safety and don,t is ratio is quite low, as well as the number of speed cameras on road side is high ratio of too many from too few, and about right while don,t know ratio is quite low.
AI examiner evaluation
| Criterion | Band |
|---|---|
| Task Achievement / Task Response | 5.0 |
| Coherence and Cohesion | 5.0 |
| Lexical Resource | 4.5 |
| Grammatical Range and Accuracy | 4.5 |
| Overall | 5.0 |
Task Achievement / Task Response: Band 5.0
You identify both charts and refer to all three survey questions, so the response covers the main components of the task. You also report the strong rise in fines, from 200,000 to 1.6 million, and correctly note that the survey’s “No” response exceeds “Yes.” However, the overview is unclear and includes a major misinterpretation: “overall the speed cameras reduce the number of accident” contradicts the survey, where 60% said they do not reduce accidents and only 32% said they do. The fatalities description is also too vague to show the pattern accurately; deaths fluctuate around 3,100–3,350 rather than clearly falling and then rising. Select the key trends and state them precisely, supported by a few accurate comparisons.
Coherence and Cohesion: Band 5.0
There is some organisation: the response first introduces the charts, then discusses fines and fatalities, and finally turns to the survey. Phrases such as “On one hand,” “On the other hand,” and “overall” show an attempt to guide the reader. However, the progression is not consistently clear, and the two chart descriptions are difficult to follow because several ideas are compressed into long, loosely connected sentences. The final paragraph lists survey results without clearly separating the three questions, while repeated uses of “ratio” make the relationships harder to track. Use distinct paragraphs for the overview, chart trends, and survey findings, and connect each point with clear references such as “Regarding public opinion” or “By contrast.”
Lexical Resource: Band 4.5
The response attempts task-related vocabulary, including “speed cameras,” “installation,” “road safety,” and “raise revenue,” and uses figures to describe change. However, word choice and collocation are often inaccurate or unclear, sometimes making the intended meaning difficult to understand. Examples include “road accidents facilities,” “driver community peoples,” “overly exaggerate,” and “climb over to the last year.” “Ratio” is also repeatedly used where “percentage” or “proportion” is needed for survey results. Spelling and word forms such as “belows,” “getted,” and “don,t” further reduce control. Build a reliable set of chart-description phrases—such as “rose steadily,” “fluctuated,” and “accounted for”—and check that each word fits its context.
Grammatical Range and Accuracy: Band 4.5
You attempt to combine ideas in longer sentences, but control of sentence structure is limited and errors occur frequently enough to make parts of the report difficult to interpret. For example, “The graph belows show the number of drivers … that an past eight years structure” has problems with subject–verb agreement and sentence construction. In “which is in first year 3000 and partially go down,” the verb forms and clause structure are unclear; the final sentence also runs several separate ideas together without effective punctuation. Articles, plurals, and tense patterns are often missing or inconsistent. Practise writing short, complete sentences first, then add one subordinate clause at a time. Check agreement, articles, and punctuation when revising.
See this exact question answered at other band scores. The same prompt compared across bands.
Browse more IELTS Writing model answers or get your own writing scored by the same AI examiner.