Band 6.0 IELTS Writing Task 1 Model Answer
Overall Band Score: 6.0 · IELTS Complete Catalyst · 2026-11-09
IELTS Writing Task 1 question
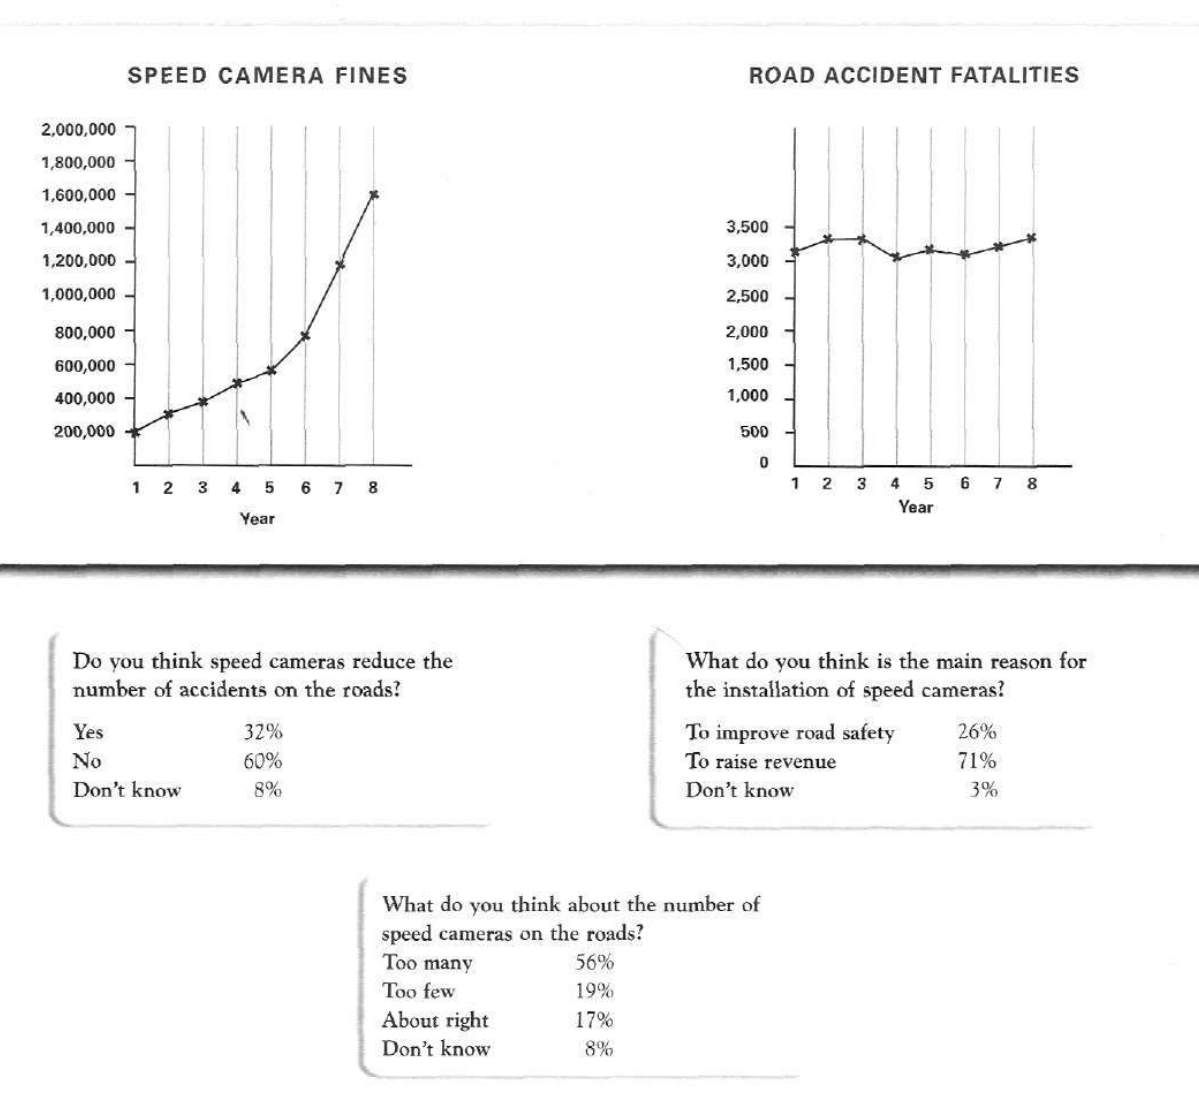
The graphs below show the number of drivers in Britain who have been caught driving too fast by speed cameras placed on roads, and the number of people killed in road accidents, over an eight-year period since the introduction of speed cameras. The tables show the results of a survey on people's opinions on speed cameras.
Write a report for a university lecturer describing the information below.
SPEED CAMERA FINES and ROAD ACCIDENT FATALITIES
Student answer (Band 6.0)
The graphs illustrates the number of drivers caught by speed camera placed on roads while driving extremely fast, number of people killed in accidents. These numbers have been taking into account for eight years since the speed cameras have been introduced. The table presents the data on opinion of people on speed cameras.
Overall, Fines have been risen in recent years compared to previous years which is a dramatic change. In answer to given questionnaires , most people have not given the positive reviews about installation of cameras.
The number of speed camera fines have been increasing for 8 years . At first the rise in fine was not so sudden for example , in first year monetary penalty was 2 lakh which after that immediately increased to 8 lakh in 6 year and then to 1.6 million in 8 year . Moreover, in road accident fatalities , the number of died people have not rose or fell suddenly and almost constant .
In people given opinion on the reduction of accident , No was the most common response which was 60% as compared to yes and do not know .Furthermore, in opinion to main reason for speed cameras more people gave vote to raise revenue which was 71%. On the other hand, people favor too many to the question about number of speed cameras which was 56%.
AI examiner evaluation
| Criterion | Band |
|---|---|
| Task Achievement / Task Response | 6.0 |
| Coherence and Cohesion | 6.5 |
| Lexical Resource | 5.5 |
| Grammatical Range and Accuracy | 5.0 |
| Overall | 6.0 |
Task Achievement / Task Response: Band 6.0
You cover both the charts and the survey, and your overview identifies the main contrast: fines rose substantially, while fatalities stayed broadly stable. You also report several key survey results accurately, including 60% saying cameras do not reduce accidents, 71% believing revenue is the main reason for their installation, and 56% thinking there are too many. However, some chart details are imprecise: fines did not jump directly from 200,000 to 800,000; they rose gradually before accelerating, reaching about 780,000 in year six. The fatalities also fluctuated slightly rather than remaining completely constant. The overview’s claim that people gave generally negative reviews is broad; distinguish their views on effectiveness, purpose and camera numbers more clearly.
Coherence and Cohesion: Band 6.5
The report has a clear overall arrangement: an introduction, an overview, a paragraph on the graphs and a final paragraph on the survey. This makes the information easy to follow, and linking expressions such as “Overall,” “Moreover” and “On the other hand” help signal relationships. The progression is generally logical, but some connections are mechanical or unclear. For example, “In people given opinion on the reduction of accident” does not smoothly introduce the survey finding, and “On the other hand” does not express a strong contrast between the revenue response and views on camera numbers. Grouping the three survey questions more deliberately, and using clearer references such as “Regarding the perceived purpose,” would make cohesion more flexible and precise.
Lexical Resource: Band 5.5
You use a relevant range of vocabulary for describing trends and survey results, including “increasing,” “dramatic change,” “almost constant” and “most common response.” The meaning is usually recoverable, but several word choices and collocations are inaccurate or unnatural, which limits precision. For instance, “positive reviews” is not quite suitable for survey opinions, “gave vote to raise revenue” is awkward, and “the number of died people” is not idiomatic. “Monetary penalty” is understandable but less direct than “fines.” There is also inconsistent capitalization, as in “Fines” mid-sentence. Aim for standard chart-reporting phrases such as “the number of fatalities,” “respondents believed,” and “fines rose,” while avoiding overly conversational wording.
Grammatical Range and Accuracy: Band 5.0
You attempt both simple and more complex sentences, and the report’s main meaning is generally clear. However, errors in agreement, verb forms, articles and sentence construction occur across the response. Examples include “The graphs illustrates,” “These numbers have been taking into account,” and “The number of speed camera fines have been increasing”; these should use appropriate subject–verb agreement and verb forms. The phrase “the number of died people have not rose or fell” also combines incorrect forms and agreement. Some punctuation and spacing around commas and full stops are inconsistent. To improve control, check each sentence for its subject and verb, use past simple consistently for the completed eight-year period, and build shorter, accurate sentences before adding complex clauses.
See this exact question answered at other band scores. The same prompt compared across bands.
Browse more IELTS Writing model answers or get your own writing scored by the same AI examiner.