Band 5.5 IELTS Writing Task 1 Model Answer
Overall Band Score: 5.5 · IELTS Complete Catalyst · 2026-11-09
IELTS Writing Task 1 question
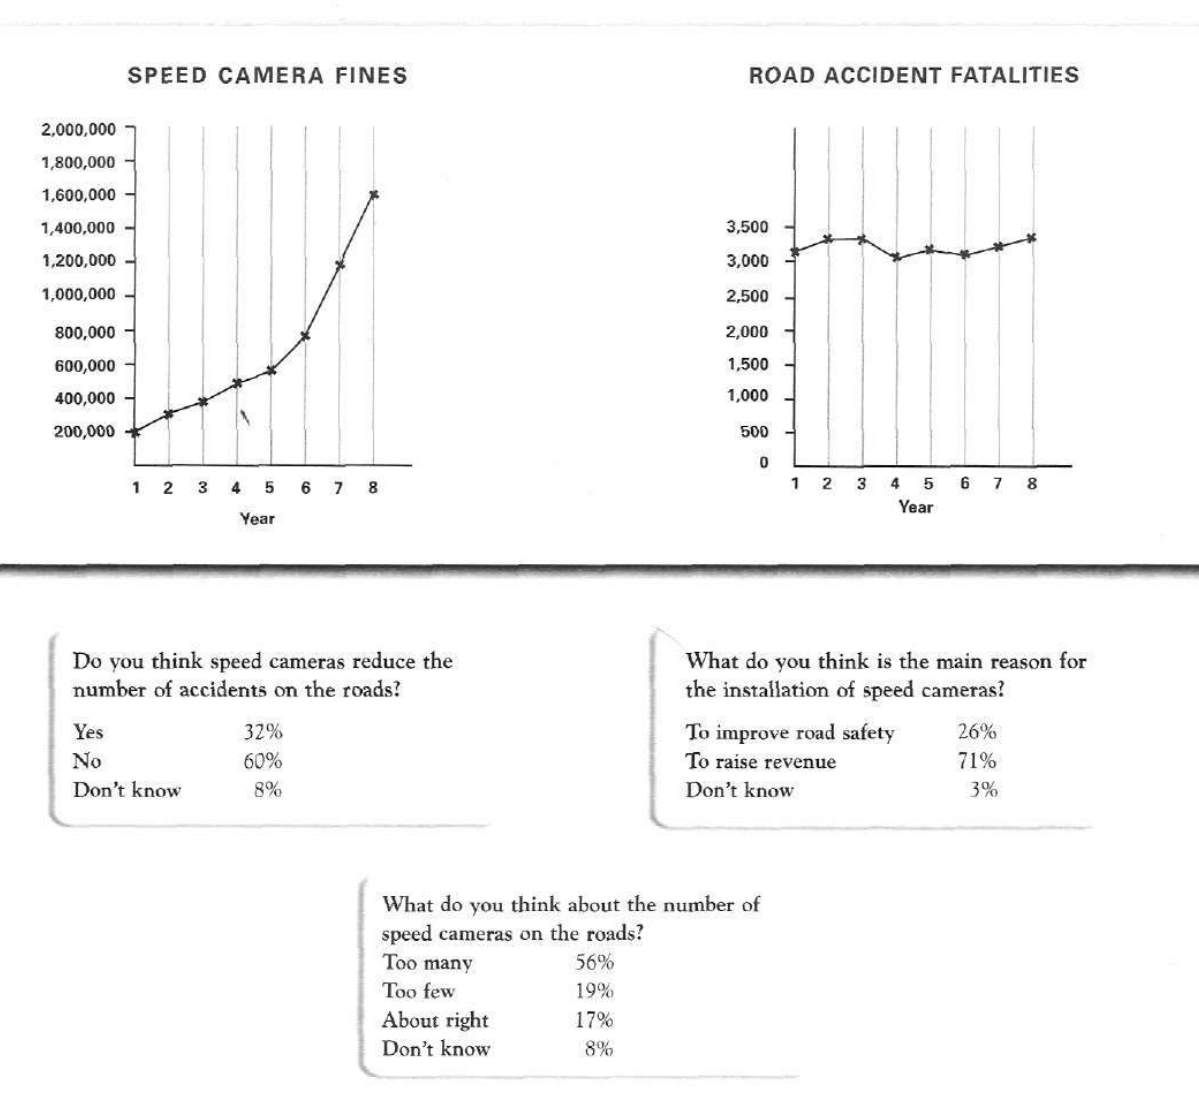
The graphs below show the number of drivers in Britain who have been caught driving too fast by speed cameras placed on roads, and the number of people killed in road accidents, over an eight-year period since the introduction of speed cameras. The tables show the results of a survey on people's opinions on speed cameras.
Write a report for a university lecturer describing the information below.
SPEED CAMERA FINES and ROAD ACCIDENT FATALITIES
Student answer (Band 5.5)
This chart shows Speed camera fines and accident fatalities respectively. Over past eight years, the fines were increased gradually. That clealy shows that drivers were driving too fast over the past 8 years. The highest fine was recorded in the last year which was [redacted phone].The least fine was recorded in the first year after cameras were introduced,which is [redacted phone]. The right next graph shows the Road accident fatalities. It shows that there are almost same accross the past eight years of cameras introduced. That amount deviate between 3000 to 3500. Public perception says that speed cameras reduce the number of accidents on the roads during the survey. Further Public think that main reason for installing speed cameras is to raise revenue. Only 26 percent think that is to increase road safety. Majority of public says that there are too many speed cameras on the road,which is 56 percent.Only 19 percent says that is too few.
AI examiner evaluation
| Criterion | Band |
|---|---|
| Task Achievement / Task Response | 5.5 |
| Coherence and Cohesion | 5.0 |
| Lexical Resource | 5.5 |
| Grammatical Range and Accuracy | 5.0 |
| Overall | 5.5 |
Task Achievement / Task Response: Band 5.5
You cover both the charts and the survey, and identify the main contrast: fines rose substantially while fatalities stayed broadly stable. The figures of 1,600,000 in the final year and 200,000 in the first year are accurate, as are the 71% who thought cameras were installed to raise revenue and the 56% who considered there were too many. However, the survey result on whether cameras reduce accidents is reversed: 60% said no, while only 32% said yes; your statement that the public thinks they reduce accidents is therefore misleading. The fatalities range is also described too broadly as 3,000–3,500. An overview is present but limited, and the explanation that rising fines prove drivers were speeding is not directly established by the chart.
Coherence and Cohesion: Band 5.0
The response follows a generally understandable order, moving from the fines chart to fatalities and then to the survey. Basic links such as “Further” and “Only” help connect some points, and the reader can identify the main topics. However, the report is presented as one continuous paragraph, so the different visual elements are not clearly grouped. Progression is also weakened by abrupt transitions such as “The right next graph” and by the unclear reference in “Public perception says that speed cameras reduce…” A clearer structure—with an overview followed by separate paragraphs for the charts and survey—and more precise linking would make the information easier to follow. Avoid relying on repeated sentence openings such as “It shows” and “The…”.
Lexical Resource: Band 5.5
You use relevant vocabulary for describing the visuals, including “gradually,” “recorded,” “deviate,” “main reason,” and “majority.” This gives you enough language to communicate the broad trends and survey findings. However, several choices are inaccurate or unnatural: “fines were increased” suggests an external action rather than a rise in the number of fines, and “That amount deviate” is not an appropriate way to describe the fatalities fluctuating. “Public perception says” is also an awkward collocation. There are noticeable spelling and form errors, including “clealy” and “accross,” which reduce precision. Aim for standard chart-reporting phrases such as “the number of fines rose” and “fatalities fluctuated within a narrow range.”
Grammatical Range and Accuracy: Band 5.0
Your response uses mostly short, simple statements, with a few attempts to add detail, for example, “The highest fine was recorded in the last year which was 1600000.” However, grammatical errors occur frequently and sometimes make relationships unclear. Examples include “Over past eight years” (missing an article), “the fines were increased” (incorrect verb construction for the trend), and “That amount deviate” (subject–verb agreement). In “Only 26 percent think that is to increase road safety,” the clause is incomplete or unclear, while “there are almost same” lacks a necessary complement. Punctuation and spacing are also inconsistent, particularly around commas and sentence boundaries. Practise accurate simple sentences first, then combine them with controlled relative clauses and comparisons.
See this exact question answered at other band scores. The same prompt compared across bands.
Browse more IELTS Writing model answers or get your own writing scored by the same AI examiner.