Band 6.5 IELTS Writing Task 1 Model Answer
Overall Band Score: 6.5 · IELTS Complete Catalyst · 2026-11-10
IELTS Writing Task 1 question
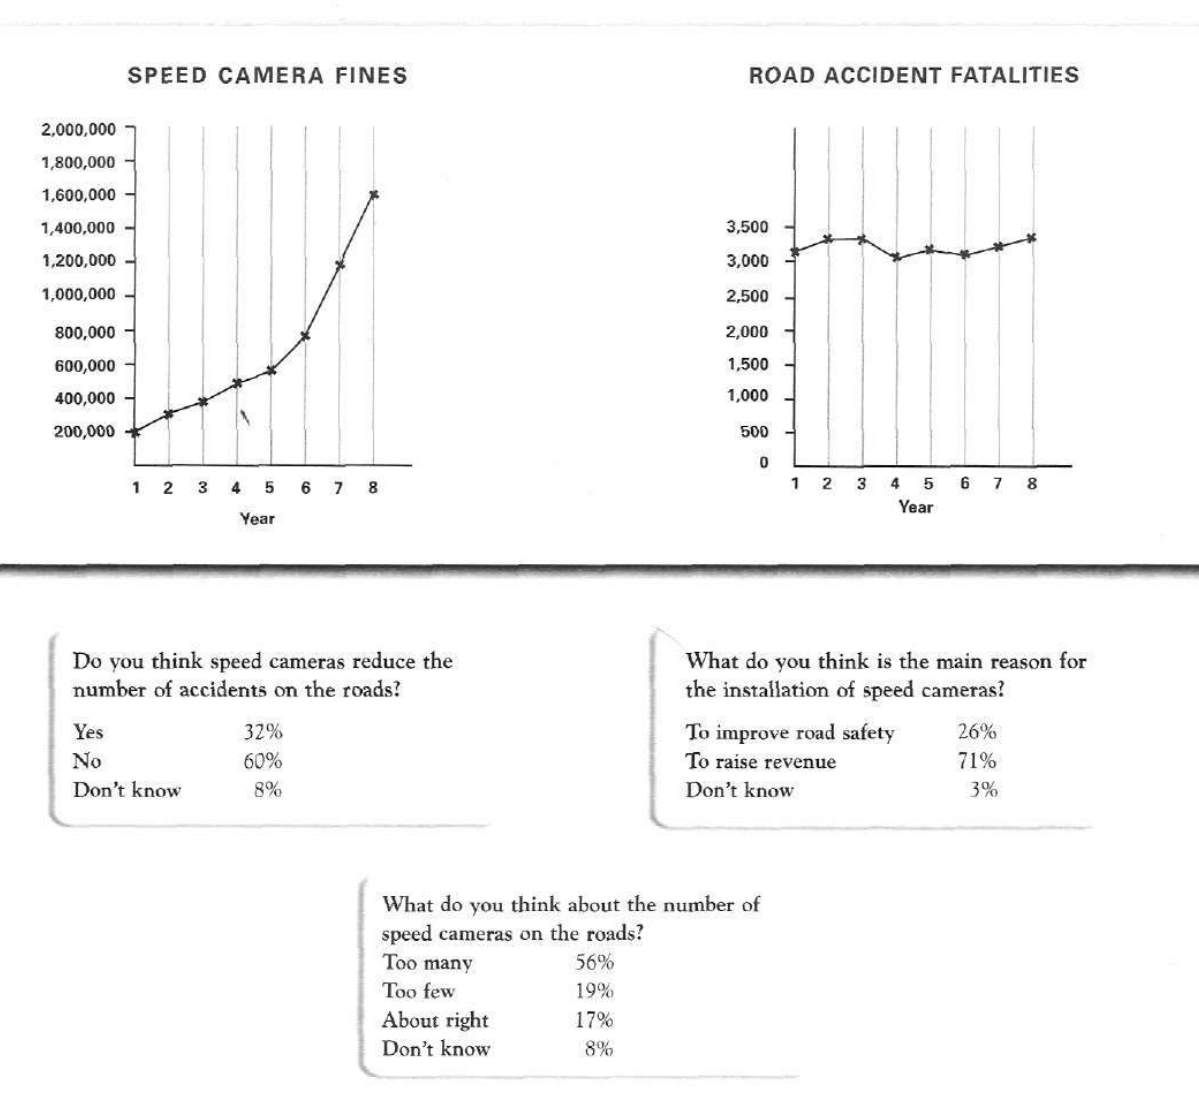
The graphs below show the number of drivers in Britain who have been caught driving too fast by speed cameras placed on roads, and the number of people killed in road accidents, over an eight-year period since the introduction of speed cameras. The tables show the results of a survey on people's opinions on speed cameras.
Write a report for a university lecturer describing the information below.
SPEED CAMERA FINES and ROAD ACCIDENT FATALITIES
Student answer (Band 6.5)
The line graphs illustrate the number of motorists in Britain who were caught speeding by road cameras and the number of people fatalities in road accidents during eight years following the introduction of speed cameras . Meanwhile, the provided table presents the findings of a survey regarding public opinions about speed cameras.
Overall, the speed camera fines increased significantly over the eight following years but road accident fatalities remain almost same in those years. On the other hand, a large number of individuals think speed cameras did not decrease the number of road accidents . They also believe that the main reason for camera installation is just to raise revenue, also there are too many speed cameras on the roads.
Speed camera fines were [redacted phone] in the first year, and it increased steadily in the following years and reached [redacted phone] in next 8 years. In contrast, the road accident fatalities were approximately 3100 in the same year when installed speed cameras ,in next following years the fatalities fluctuated slightly but remained almost same as beginning year.
On the other side, 60% public believes that speed cameras did not reduce road fatalities, while 32% believes that it reduced road deaths and 8% people do not know about the topic. 71% people also think that speed cameras installed just for raise revenue, while other think road cameras improves road safety and 3% people do not know. 56% individuals comment that there are too many cameras on the street, while 19% think the amount are too fee, 17% comment the numbers are right and 8% people don’t know about the issue.
AI examiner evaluation
| Criterion | Band |
|---|---|
| Task Achievement / Task Response | 7.5 |
| Coherence and Cohesion | 6.5 |
| Lexical Resource | 6.0 |
| Grammatical Range and Accuracy | 5.5 |
| Overall | 6.5 |
Task Achievement / Task Response: Band 7.5
The report covers both graphs and all three survey questions, and its overview identifies the main contrast accurately: fines rose substantially while fatalities stayed broadly stable, and most respondents were sceptical about cameras. The survey figures are generally reported correctly, including the 60% who said cameras did not reduce accidents and the 71% who thought revenue was the main purpose. The graph description also gives the correct starting and ending fine totals. However, the account of fatalities is imprecise: it says they were about 3,100 in the first year, whereas the chart shows about 3,150, and it does not describe the modest rise and fall across the period. More precise selection of key movements would strengthen an otherwise clear and relevant response.
Coherence and Cohesion: Band 6.5
The response has a clear overall structure: an introduction, an overview, a paragraph on the graphs and a final paragraph on the survey. This makes the information easy to locate, and contrasts such as “In contrast” help distinguish the two graph trends. The overview also brings the survey findings together effectively. However, some linking is mechanical or awkward, particularly the repeated “On the other hand” and “On the other side,” and the final paragraph becomes a long sequence of figures joined mainly by “while.” Grouping the survey results into clearer comparisons and using more varied, precise transitions would improve flow. There is a coherent progression, but cohesion is not consistently smooth.
Lexical Resource: Band 6.0
The vocabulary is adequate for describing the visuals, with useful terms such as “fluctuated slightly,” “increased significantly,” “findings,” and “installation.” The writer also varies references to the data using “motorists,” “individuals,” and “public.” However, some word choices and collocations are inaccurate or unnatural, including “people fatalities,” “for raise revenue,” and “too fee.” “Road cameras” and “street” are also less precise than the task’s terms, and “just” makes the description sound informal. These choices do not prevent the reader from understanding the main points, but they limit precision and naturalness. More consistent use of accurate chart-reporting vocabulary would strengthen the range.
Grammatical Range and Accuracy: Band 5.5
The response attempts a mix of simple and more complex sentences, including contrast structures such as “In contrast” and clauses describing survey results. Meaning is generally recoverable, but grammatical control is uneven. Examples include “fatalities remain almost same,” where the tense and article are missing, and “it increased steadily … and reached … in next 8 years,” where the reference and article are unclear. There are also agreement errors in “60% public believes” and “other think,” as well as punctuation problems, such as spaces before full stops and a comma splice in the graph paragraph. Check tense consistency, articles, subject–verb agreement and sentence boundaries; these corrections would make the report more accurate and easier to read.
See this exact question answered at other band scores. The same prompt compared across bands.
Browse more IELTS Writing model answers or get your own writing scored by the same AI examiner.