Band 5.5 IELTS Writing Task 1 Model Answer
Overall Band Score: 5.5 · IELTS Complete Catalyst · 2026-11-10
IELTS Writing Task 1 question
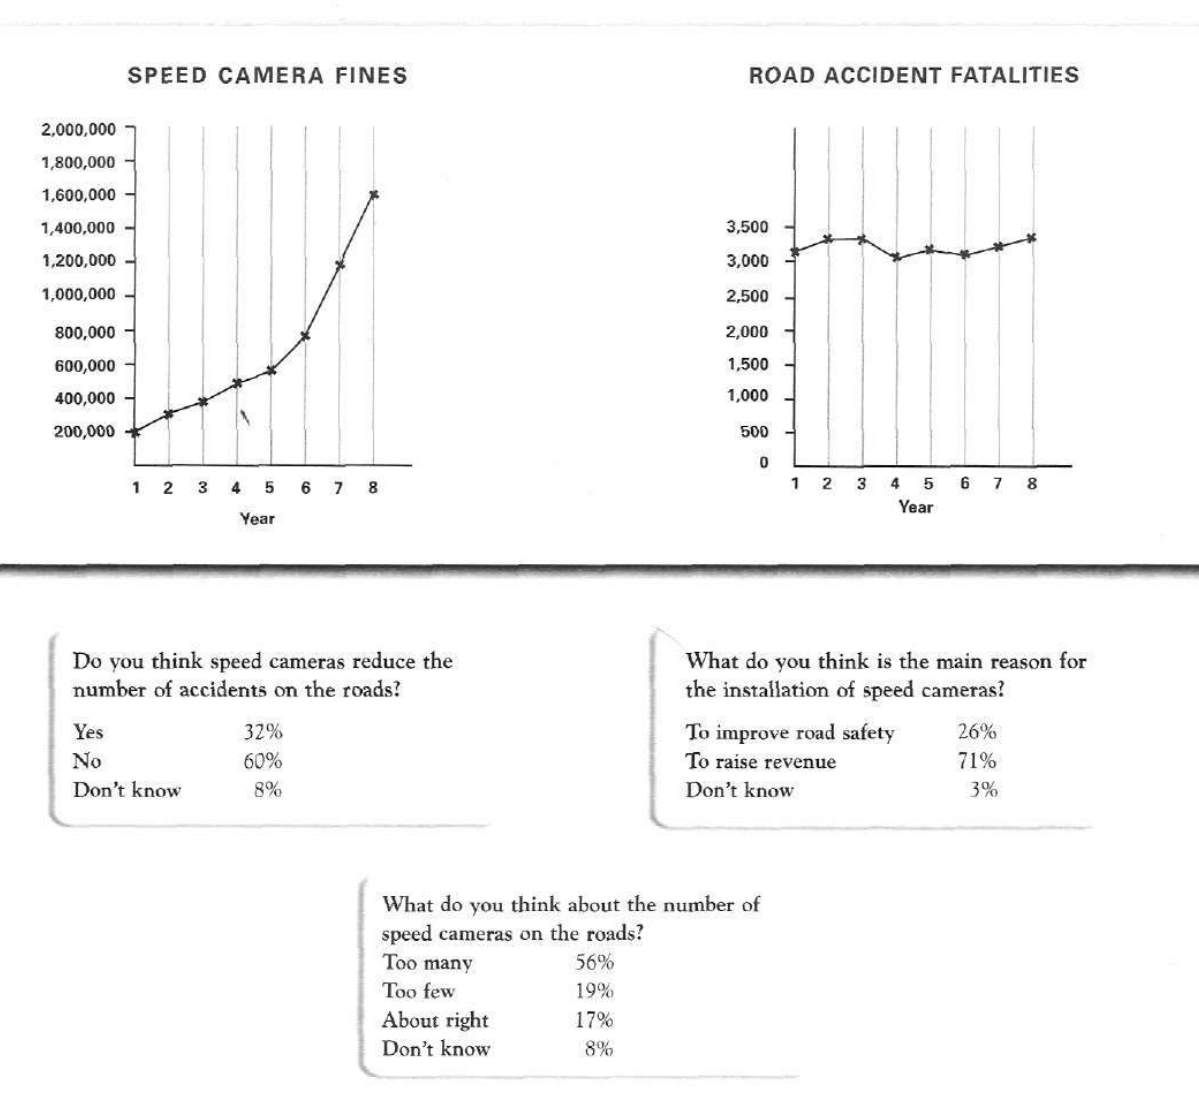
The graphs below show the number of drivers in Britain who have been caught driving too fast by speed cameras placed on roads, and the number of people killed in road accidents, over an eight-year period since the introduction of speed cameras. The tables show the results of a survey on people's opinions on speed cameras.
Write a report for a university lecturer describing the information below.
SPEED CAMERA FINES and ROAD ACCIDENT FATALITIES
Student answer (Band 5.5)
The graphs illustartes the fines imposed on overspeeding and deaths in road accidents in a span of eight years.Overall an increase is observed in fines in past eight years starting from 200,000 exceeding upto 1,600,000 in year 8 while constant fluctuation is observed in death rates starting from 3100 in year 1 to 3200 in year 8.
The increase in fines was steady during first six years from 200,000 to 700,00 but a sharp increase was observed in last two years reaching 1,600,000.Death rate increased from 3100 but was constant during year 2 to 3 then it droped to 3000 during 4 year followed by and increase during year 5 to 3100 that droped to 3000 again in year 6.Mortality due to accidents then kept on incrasing steadily during year 6 to 8 ranging 3200.Highest deaths were recorded during 2 to 3 year.
Three tables show the data of the survey conducted to sum up people thoughts on speed cameras installed.Overall many people believed that alot of cameras are installed just to increase the revenue and it has no impact on reducing rate of road accidents.
32% people believed that speed cameras had an impact in reduction of accidents while 60% opposed the idea and 8% supported neither idea.26% had this idea that speed cameras are installed to ensure people safety on roads while 71% believed it was to gain money while 3% people had not any opinion behind the resaon of instaklation of cameras.56% people though cameras are over installed while 19% opposed idea statin
AI examiner evaluation
| Criterion | Band |
|---|---|
| Task Achievement / Task Response | 6.0 |
| Coherence and Cohesion | 6.0 |
| Lexical Resource | 5.5 |
| Grammatical Range and Accuracy | 5.0 |
| Overall | 5.5 |
Task Achievement / Task Response: Band 6.0
You cover both the charts and the survey, and your overview identifies the main contrast: fines rose substantially while fatalities fluctuated. You also report several survey results accurately, including the 60% who said cameras do not reduce accidents and the 71% who thought they were installed to raise revenue. However, some chart details are inaccurate: fines reached about 780,000 in year 6, not 700,000, and fatalities were highest in year 8, not years 2–3. The description of the final fatality trend is also unclear, and the response stops before reporting the remaining camera-number opinions, including the 17% who said the number was about right and 8% who did not know. More precise coverage of these features would make the report more complete and reliable.
Coherence and Cohesion: Band 6.0
The response has a recognisable structure: an opening overview, a paragraph describing the charts, and a paragraph on the survey. This helps the reader follow the broad shift from numerical trends to public opinion. However, progression within the chart paragraph is weakened by a long sequence of year-by-year details, and some links are unclear, such as “followed by and increase” and the description of deaths from years 6 to 8. The survey discussion also ends abruptly after “19% opposed idea,” leaving the final category unfinished. Use clearer grouping—for example, describe the sharp rise in fines separately from the relatively stable fatalities—and complete each survey topic before moving on. This would make the organisation more controlled and cohesion less dependent on repeated “while” and “during” constructions.
Lexical Resource: Band 5.5
You use relevant vocabulary for describing the visuals, including “fines,” “fluctuation,” “death rates,” “reduction,” and “revenue,” so the main information is generally understandable. There are also attempts at more formal reporting language, such as “conducted” and “mortality.” However, spelling errors are noticeable, including “illustartes,” “droped,” “incrasing,” “resaon,” and “instaklation.” Some expressions are imprecise or unnatural, such as “over installed,” “gain money,” and “people thoughts.” Repetition of “increase” and “during” also limits flexibility. Aim for accurate collocations such as “the number of fatalities fluctuated” and “cameras were installed to generate revenue,” and proofread spelling carefully. These changes would make your vocabulary more precise and appropriate to an academic report.
Grammatical Range and Accuracy: Band 5.0
You attempt both simple and more complex sentences, including contrasts with “while” and clauses describing changes over time. The overall meaning is usually recoverable, but some sentence structures are faulty or incomplete. For example, “The increase in fines was steady during first six years” needs an article before “first six years,” while “followed by and increase” has an incorrect construction. In “32% people believed,” the noun phrase needs a determiner or a different structure, such as “32% of people believed.” Punctuation is also inconsistent: there are missing spaces after full stops, and several long sentences would benefit from clearer sentence boundaries. Work on articles, prepositions, and complete clause structure, while retaining your attempts to combine comparisons and trends.
See this exact question answered at other band scores. The same prompt compared across bands.
Browse more IELTS Writing model answers or get your own writing scored by the same AI examiner.