Band 6.0 IELTS Writing Task 1 Model Answer
Overall Band Score: 6.0 · IELTS Complete Catalyst · 2026-11-10
IELTS Writing Task 1 question
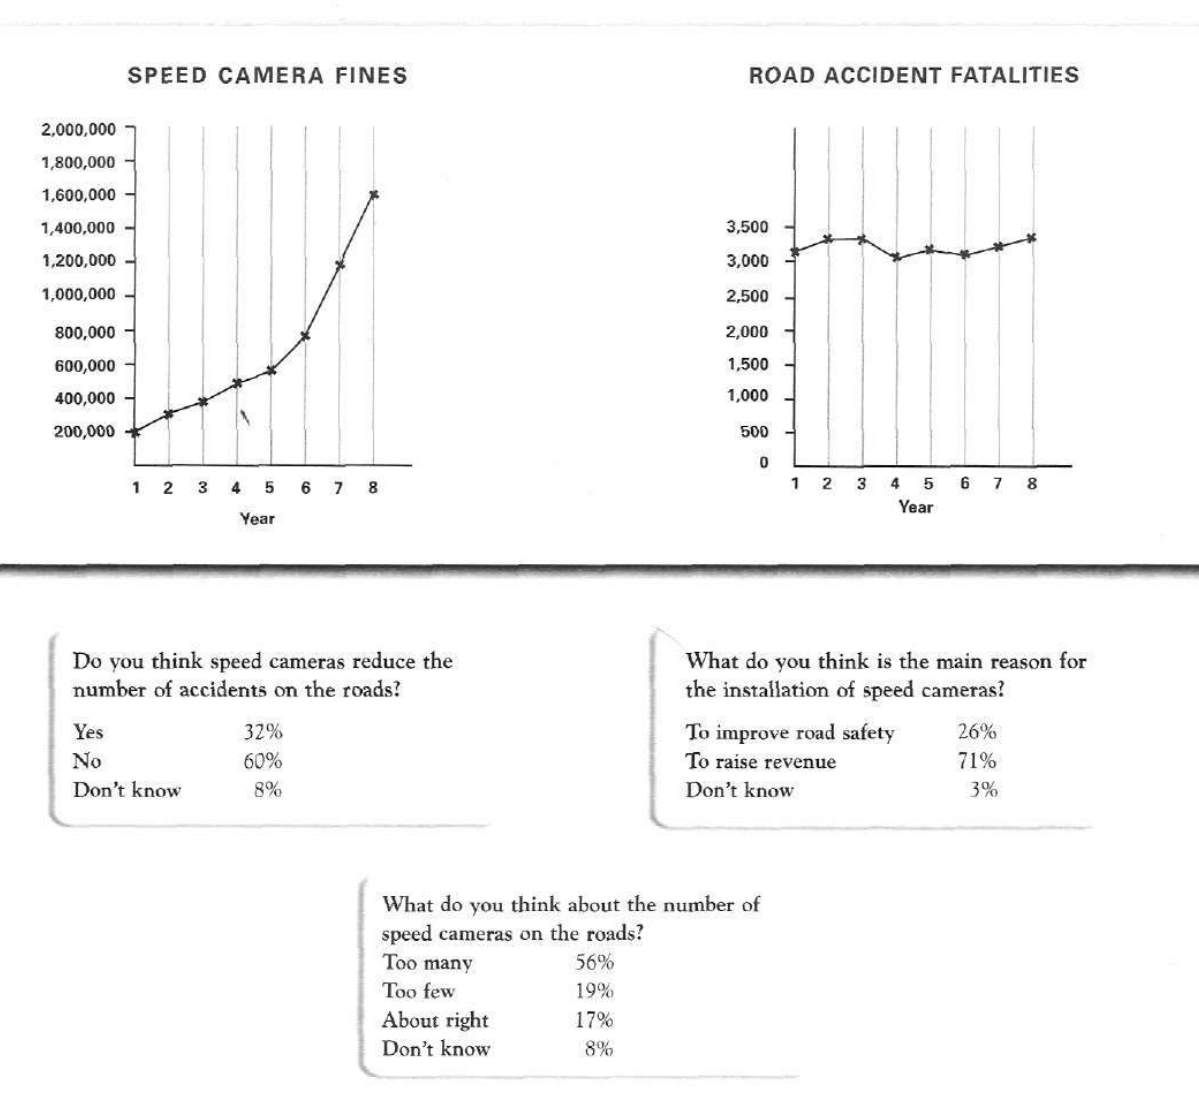
The graphs below show the number of drivers in Britain who have been caught driving too fast by speed cameras placed on roads, and the number of people killed in road accidents, over an eight-year period since the introduction of speed cameras. The tables show the results of a survey on people's opinions on speed cameras.
Write a report for a university lecturer describing the information below.
SPEED CAMERA FINES and ROAD ACCIDENT FATALITIES
Student answer (Band 6.0)
The first graph illustrates the number of speed camera fines and the second one shows number of accidents in a period of 8 years. The tables represent public opinion on speed cameras. Based on the data, I agree with the public opinion.
The first graph seems to show a cumulative graph of the number of drivers caught driving too fast. In the first 5 years, the growth rate of number of fines was not high. But, a sudden tweak in speed camera fines number can be noticed in the last three years where the inclination of the graph was sharper. Then again, there was not much difference in the number of fatalities throughout the eight years. Road accident fatalities number remained between 3000 and 3500.
Since, the road accidents remain same in the period of eight years, I agree with the public opinion of speed cameras not reducing the number of road accidents with a 60% vote on "No". Majority of the public believe that speed caneras were installed just to raise revenue. They also believe that there are too many speed cameras on the road.
AI examiner evaluation
| Criterion | Band |
|---|---|
| Task Achievement / Task Response | 6.0 |
| Coherence and Cohesion | 6.0 |
| Lexical Resource | 6.0 |
| Grammatical Range and Accuracy | 6.0 |
| Overall | 6.0 |
Task Achievement / Task Response: Band 6.0
You cover the main elements by describing the rise in fines, the broadly stable fatalities, and the survey findings. The overview that fatalities stayed between roughly 3,000 and 3,500 is relevant, and you correctly identify the public’s dominant views: 60% said cameras do not reduce accidents, 71% thought revenue was the main reason, and 56% considered there to be too many cameras. However, the description of the fines is imprecise: the increase becomes especially steep in years 7 and 8, rather than across all of the last three years, and the figures are not supported with specific comparisons. The opening also calls the second graph one about accidents rather than fatalities. Your interpretation is relevant, but the report would be stronger with a clearer overview and more precise data selection.
Coherence and Cohesion: Band 6.0
The response has a generally understandable sequence: it introduces the visuals, describes the two graphs, and then discusses the survey. Paragraphing helps separate the graph information from your interpretation. Some links between ideas are less clear or mechanical, however. For example, “Since, the road accidents remain same” repeats the earlier point without smoothly connecting it to the survey results, and “Based on the data, I agree with the public opinion” introduces a personal stance that is not needed in an academic report. The final paragraph also groups several survey findings together without giving their percentages or clearly distinguishing them. Use a concise overview followed by organised detail paragraphs, and use linking phrases to show comparisons rather than repeating conclusions.
Lexical Resource: Band 6.0
You use a reasonable range of task-related vocabulary, including “cumulative graph,” “growth rate,” “fatalities,” and “revenue,” so the main information is usually clear. Some choices are inaccurate or unnatural, such as “a sudden tweak” for a sharp increase and “inclination of the graph” for its slope. “The number of accidents” is also less precise than “road fatalities” when describing the second graph. There is a spelling error in “caneras,” and phrases such as “number of speed camera fines” are repeated rather than varied. Aim for accurate chart language and natural collocations, for example “the number of fines rose sharply” and “fatalities fluctuated within a narrow range.”
Grammatical Range and Accuracy: Band 6.0
You use both simple statements and more complex structures, including “Since the road accidents remain same in the period of eight years, I agree…” This shows some ability to connect clauses, and the meaning is generally understandable. Some grammatical errors remain: “shows number of accidents” needs an article, “the growth rate of number of fines” needs “the,” and “the road accidents remain same” requires a more natural construction such as “the number of fatalities remained broadly stable.” The comma after “Since” is also unnecessary, and “Majority of the public believe” needs an article or a different subject construction. Check articles, noun phrases, and punctuation, while retaining your attempts at varied sentence structures.
See this exact question answered at other band scores. The same prompt compared across bands.
Browse more IELTS Writing model answers or get your own writing scored by the same AI examiner.