Band 5.0 IELTS Writing Task 1 Model Answer
Overall Band Score: 5.0 · IELTS Complete Catalyst · 2026-11-11
IELTS Writing Task 1 question
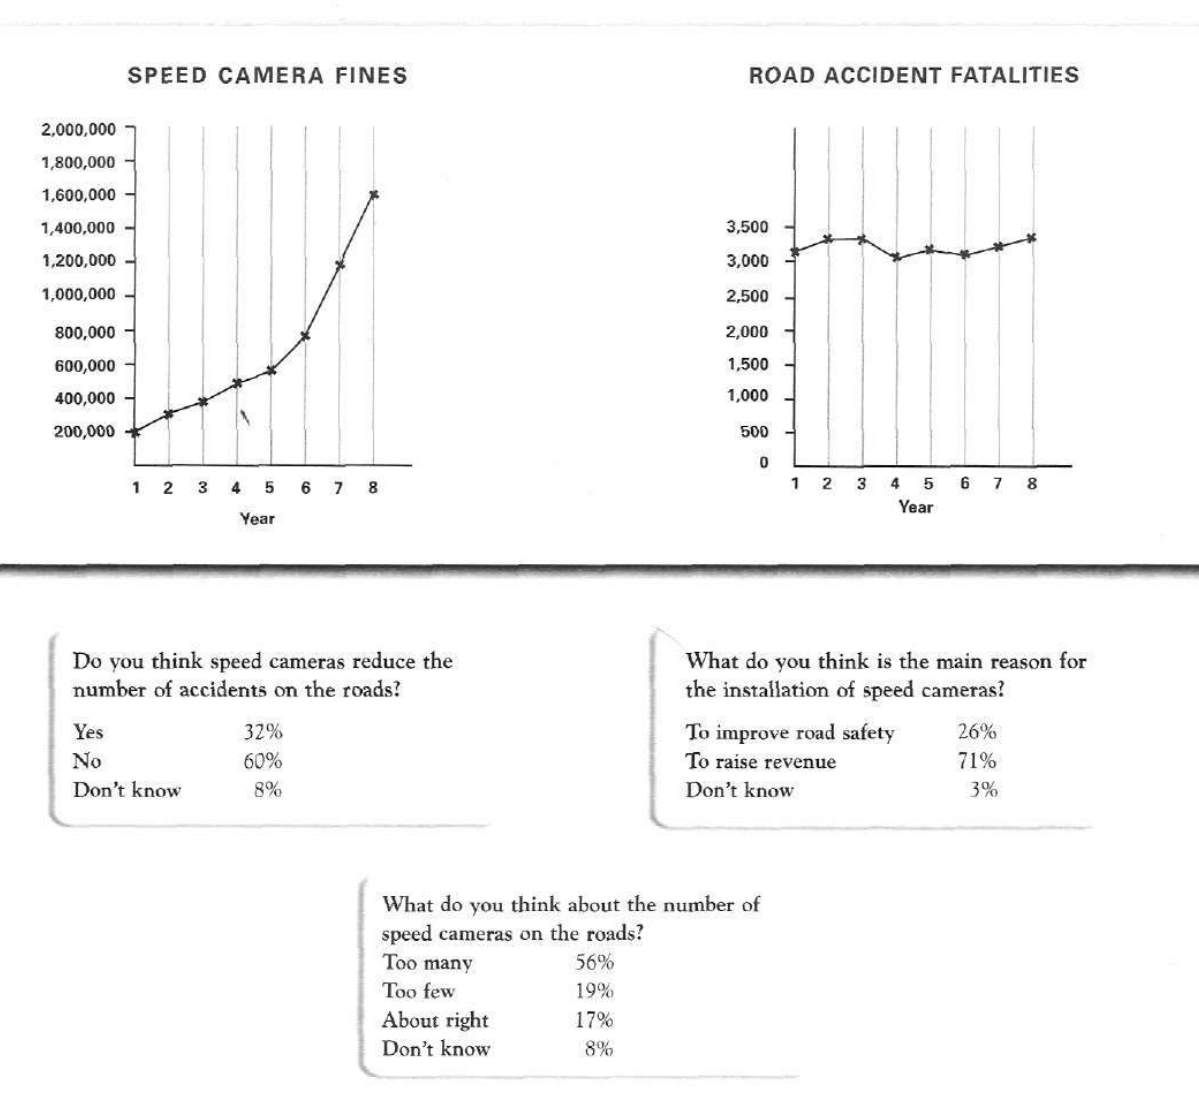
The graphs below show the number of drivers in Britain who have been caught driving too fast by speed cameras placed on roads, and the number of people killed in road accidents, over an eight-year period since the introduction of speed cameras. The tables show the results of a survey on people's opinions on speed cameras.
Write a report for a university lecturer describing the information below.
SPEED CAMERA FINES and ROAD ACCIDENT FATALITIES
Student answer (Band 5.0)
The graphs illustrates the installation of speed cameras, and the number of people killed in road accidents, over an eight-year period since the commencement of speed cameras on road.
Regarding to speed camera fines it was drastically rose upto 1,600,000 over an eight-year. After, installing the speed cameras fines increased from 200,000 to 600,000 than dramatically rose upto 1,600,000. Whereas, Road accident fatality seemed to be relative stable over an eight-year of period. In addition, road accident was increased from 3,100 to 3,400 than gradual decline to 3,000 than again rose upto 3,400.
On the other hand, 60% respodents think speed camera do not reduce the road accident while 32% think that after installimg the speed cameras they seemd reduction in road accident and 8% think don't know why.
On the one hand, 71% people think installation of speed camera is the main reason to raise the revenue while, others 26% people think installation of camera is to improve the road safety. However, 3% people think don't know why.
In addition, 56% people think the number of speed camera on the road is too may while, 19% people think
AI examiner evaluation
| Criterion | Band |
|---|---|
| Task Achievement / Task Response | 5.0 |
| Coherence and Cohesion | 5.0 |
| Lexical Resource | 5.0 |
| Grammatical Range and Accuracy | 5.0 |
| Overall | 5.0 |
Task Achievement / Task Response: Band 5.0
You cover both the charts and the survey, and you identify the broad contrast between sharply rising fines and relatively stable fatalities. However, the report is only partially complete: the final survey point is cut off after “19% people think,” so the figures for “about right” and “don’t know” are omitted. Some chart details are also inaccurate or unclear. For example, fines rose from about 200,000 to 1.6 million, but the intermediate figure was around 580,000 by year five, not 600,000 as a clear endpoint. Fatalities fluctuated rather than following the sequence described, and the final value was about 3,350. Add a concise overview and report the main trends and survey results accurately.
Coherence and Cohesion: Band 5.0
The response has separate paragraphs for the charts and survey, which gives it some basic organisation, and phrases such as “Whereas” and “In addition” show an attempt to connect information. However, there is no clear overall progression: the first paragraph introduces the topic, but the report moves directly into details without a distinct overview. Several transitions are awkward or do not clarify the relationship between ideas, such as “On the other hand” and “On the one hand” when presenting survey findings. The final paragraph also stops mid-sentence, leaving the survey section incomplete. Organise the report into an introduction, an overview, and focused detail paragraphs, and use linking expressions only where their meaning fits.
Lexical Resource: Band 5.0
You use some relevant task vocabulary, including “speed camera fines,” “road accident,” “revenue,” and “road safety,” so the topic is generally understandable. However, the range is limited and several word choices or forms are inaccurate, sometimes making the meaning less clear. For instance, “the installation of speed cameras” does not describe what the graphs measure, and “it was drastically rose” is not a natural way to describe an increase. There are also spelling errors such as “respodents,” “installimg,” and “seemd,” alongside repeated use of “think” and “people.” Use precise trend language such as “rose sharply,” “fluctuated,” and “remained broadly stable,” and check spelling and collocations.
Grammatical Range and Accuracy: Band 5.0
The response attempts some longer sentences and contrast structures, but the range is limited and errors are frequent enough to make several sentences difficult to follow. Examples include “The graphs illustrates,” where the subject and verb do not agree, and “it was drastically rose,” which combines incompatible verb forms. Other problems include “Regarding to,” “over an eight-year,” and “56% people think,” showing difficulties with prepositions, articles, and sentence patterns. The final sentence is incomplete, which also affects clarity. Practise accurate past-tense descriptions and build sentences around clear subjects and verbs—for example, “The number of fines rose from 200,000 to 1.6 million, while fatalities fluctuated around 3,000–3,350.”
See this exact question answered at other band scores. The same prompt compared across bands.
Browse more IELTS Writing model answers or get your own writing scored by the same AI examiner.