Band 4.5 IELTS Writing Task 1 Model Answer
Overall Band Score: 4.5 · IELTS Complete Catalyst · 2026-11-11
IELTS Writing Task 1 question
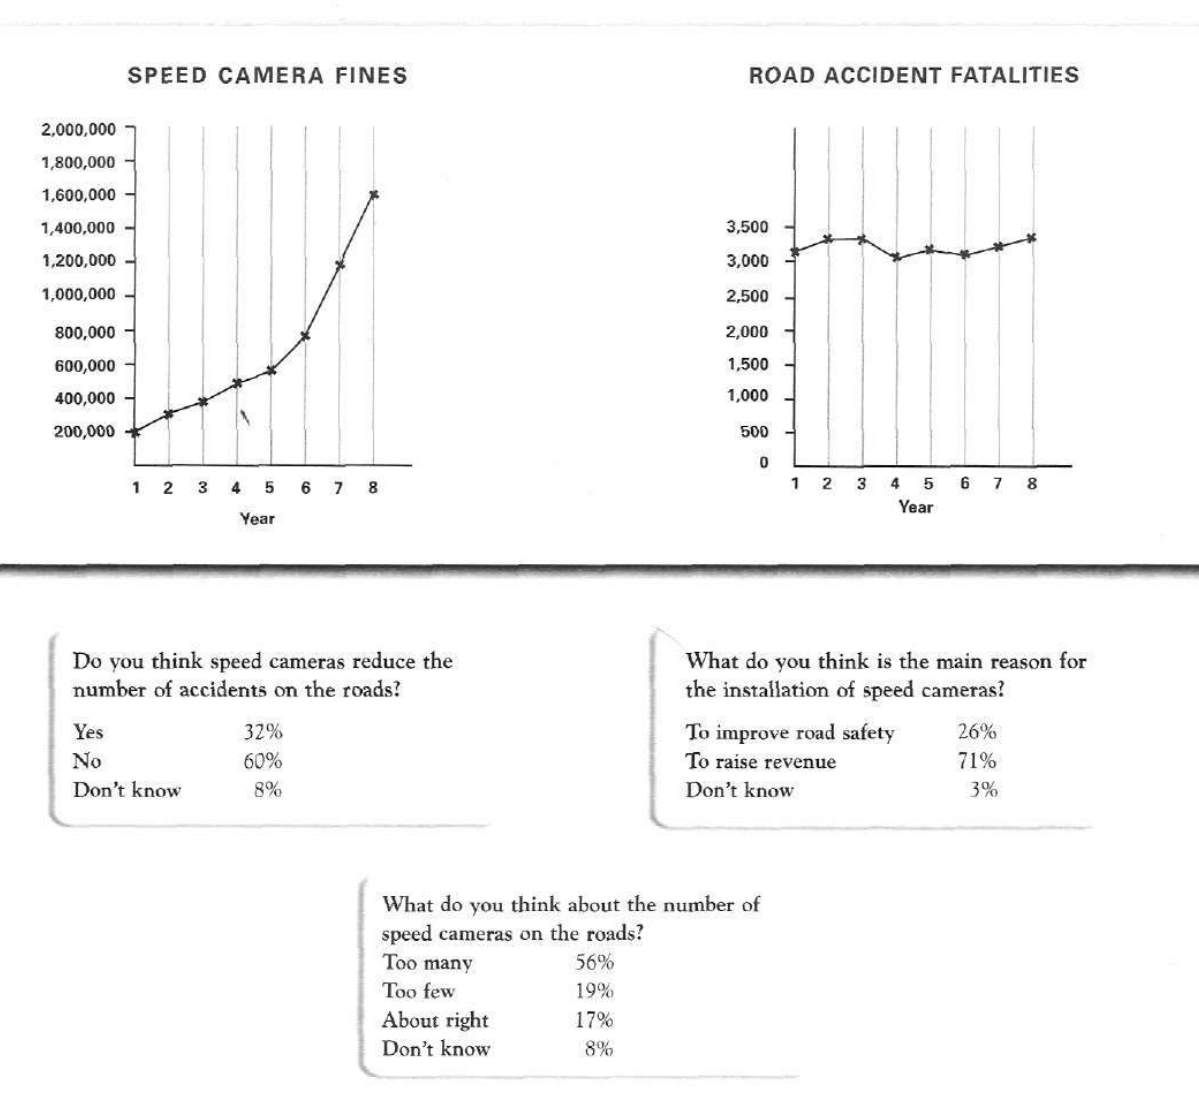
The graphs below show the number of drivers in Britain who have been caught driving too fast by speed cameras placed on roads, and the number of people killed in road accidents, over an eight-year period since the introduction of speed cameras. The tables show the results of a survey on people's opinions on speed cameras.
Write a report for a university lecturer describing the information below.
SPEED CAMERA FINES and ROAD ACCIDENT FATALITIES
Student answer (Band 4.5)
the graph one illustrate the speed camara fines emplements on fast drivers and other graph shows the road accident fatalities rate, both line graphs showing the both factors in a particular duration over an eight year period starting from when speed camaras was planted.
overall as speed camara fines figure show the goverment raise lots of revenue fromthe fine instarting i.e. first year when camaras was install the total fine was 200,000 but after 7 years the revenue was approx 1,600,000.
if i talk about road accident fatilities rate i think there is no change in death ratio, it fluctuat in between eight years but at last ther fatality rate slightly increase as showen in graph it start from approx 3,100 and end with approx 3,400.
Answer 1: i think speed camara does effect the number of accident it fails to reduce the accident number.
Answer 2: i think after instaling speed camaras the revenue raised day by day. im not sure about the percentageof revenue.
Answer 3: I think there are very few number of speed camaras on road.
AI examiner evaluation
| Criterion | Band |
|---|---|
| Task Achievement / Task Response | 4.0 |
| Coherence and Cohesion | 4.5 |
| Lexical Resource | 5.0 |
| Grammatical Range and Accuracy | 4.5 |
| Overall | 4.5 |
Task Achievement / Task Response: Band 4.0
You identify the two line graphs and give a basic overview: fines rise substantially, while fatalities fluctuate and finish slightly higher. The opening and the comparison between about 200,000 in Year 1 and 1.6 million in Year 8 are relevant. However, the report covers only the graphs and omits the survey results, which are a major part of the task. The three “Answer” sections give personal opinions rather than accurately reporting the survey percentages; for example, the survey says 60% thought cameras did not reduce accidents and 56% thought there were too many, whereas your answers state your own views. Some figures are also imprecise, such as the fatality starting point. To improve, summarise all three survey questions and select key percentages alongside the graph trends.
Coherence and Cohesion: Band 4.5
There is a basic sequence from introducing the graphs to discussing fines and fatalities, followed by three separate answers. This gives the reader some sense of the response’s parts, and phrases such as “overall” and “if I talk about” signal transitions. However, the organisation does not form a clear report: the survey information is presented as personal answers, and the paragraphs do not group the visual data into a coherent overview and supporting details. Several ideas run together in long, loosely connected sentences, while repeated “Answer” labels interrupt the flow. Use a clear introduction, an overview, and separate paragraphs for the graph trends and survey findings. Link comparisons directly, rather than relying on conversational transitions.
Lexical Resource: Band 5.0
You use some relevant task vocabulary, including “fines,” “revenue,” “fatalities,” “fluctuate,” and “reduce,” so the main subject is generally recognisable. However, the range is limited and several word choices or spellings make the report difficult to read, such as “camara,” “fatilities,” “planted,” and “death ratio.” “The government raise lots of revenue from the fine” is also an imprecise way to describe the increase in fines. Aim for accurate, neutral chart language and check spelling carefully. Useful alternatives include “speed cameras were installed,” “the number of fatalities,” and “the total number of fines rose.” Avoid conversational phrasing such as “if I talk about” in a formal report.
Grammatical Range and Accuracy: Band 4.5
The response attempts some longer sentences and uses basic time and comparison structures, for example, “it start from approx 3,100 and end with approx 3,400.” However, sentence structures are limited, and frequent errors in verb forms, agreement, articles, and punctuation sometimes make relationships unclear. Examples include “the graph one illustrate,” “cameras was install,” and “it fluctuat in between eight years.” The opening sentence also joins several ideas without clear sentence boundaries. Practise accurate simple clauses first, then combine them with controlled linking structures: for example, “Fines rose from about 200,000 in Year 1 to 1.6 million in Year 8, whereas fatalities fluctuated.” Check subject–verb agreement and past-tense forms throughout.
See this exact question answered at other band scores. The same prompt compared across bands.
Browse more IELTS Writing model answers or get your own writing scored by the same AI examiner.