Band 5.0 IELTS Writing Task 1 Model Answer
Overall Band Score: 5.0 · IELTS Complete Catalyst · 2026-11-11
IELTS Writing Task 1 question
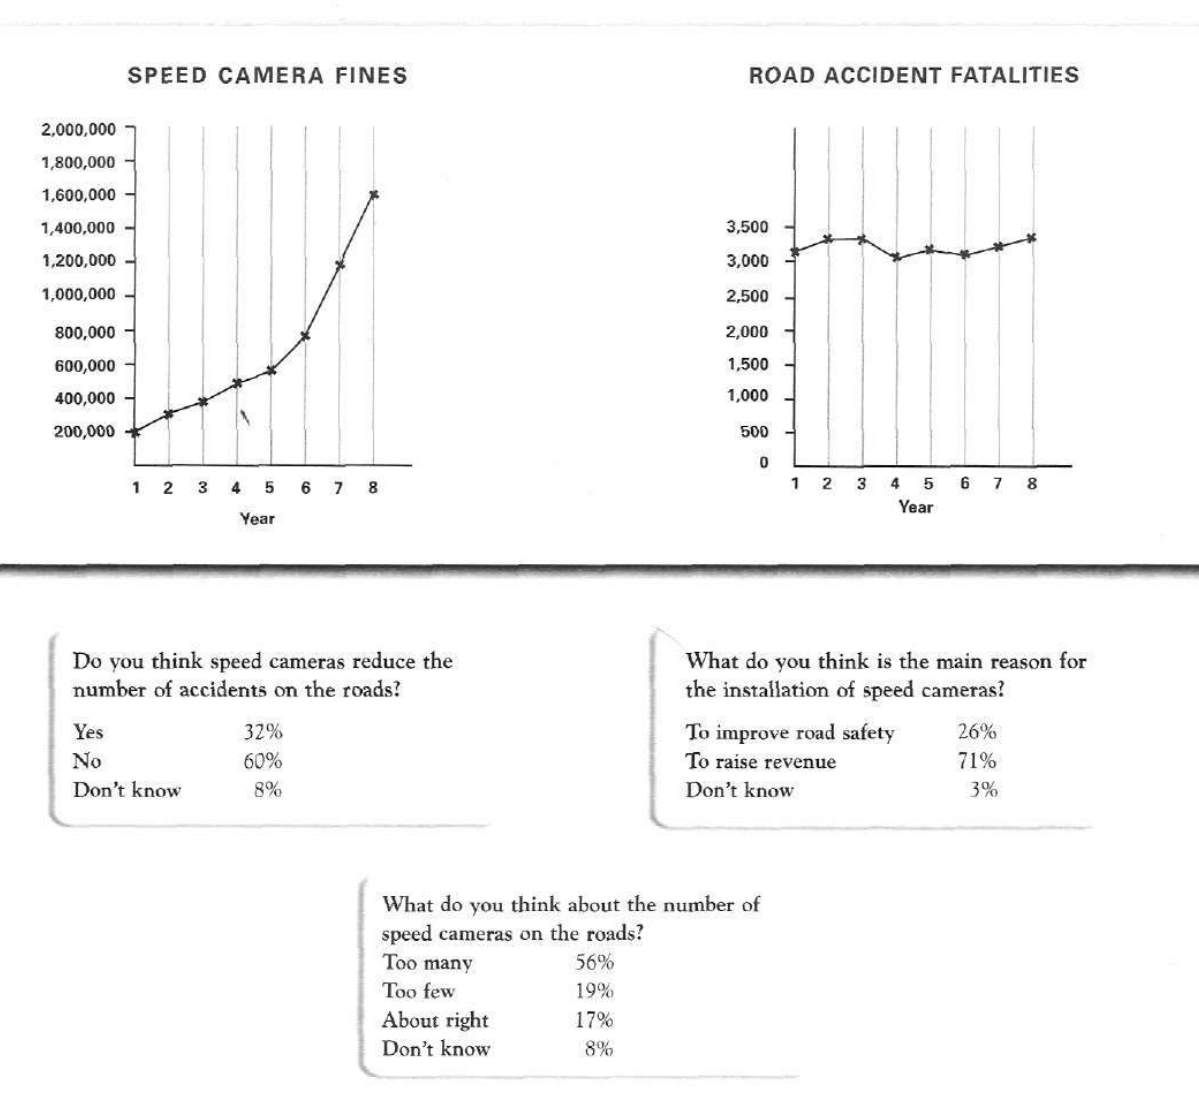
The graphs below show the number of drivers in Britain who have been caught driving too fast by speed cameras placed on roads, and the number of people killed in road accidents, over an eight-year period since the introduction of speed cameras. The tables show the results of a survey on people's opinions on speed cameras.
Write a report for a university lecturer describing the information below.
SPEED CAMERA FINES and ROAD ACCIDENT FATALITIES
Student answer (Band 5.0)
the two line graphs shown with the given paragraph show the trends realted to the speed camera fines every year and the road accident fatalities trends. in the first graph we can see 200,000 speed camera fines in 1st year, then 400,000 fines in 2nd years and the trend goes up to 2,000,000 in the 8th year.
similarly the road accidents line graph shows more than 3,000 fatalities in 1st year and around 3,400 fatalities in 2nd year. this graph does not fluctuate very much over the the 8 years. All the trends fluctuate between 3,000 to 3,500 only.
the answere to the question that if the speed cameras helped reducing the number of road accidents or not. according to the given trends on the line graph the casualities remain contant most of the time in 8 years which shows that there is not a huge difference before and after the cameras installation, however it became easier to identify the over speeders and punish them to avoid accidents in future.
according to my perspective the main reason to intall speed cameras is to improve safety on the roads, which seems very successfull too. im not sure about the number of speed cameras that have been installed on the roads because there is not information is provided about them in the line graphs and paragraph.
in conclusion i would say that installing speed cameras on the roads in a very wise decision to improve the road security and to avoid any unforscene fatalities.
AI examiner evaluation
| Criterion | Band |
|---|---|
| Task Achievement / Task Response | 4.0 |
| Coherence and Cohesion | 5.5 |
| Lexical Resource | 5.5 |
| Grammatical Range and Accuracy | 5.0 |
| Overall | 5.0 |
Task Achievement / Task Response: Band 4.0
The response identifies the broad contrast that fines rise while fatalities remain fairly stable, but it does not accurately report several key figures: fines reach about 1.6 million, not 2 million, and the second-year figure is about 300,000, not 400,000. The fatalities are also described as around 3,400 in year two, whereas they are about 3,300. More importantly, the three survey tables are not reported: instead, the response gives personal opinions about camera effectiveness, purpose and number, which do not describe the survey results. The overview is therefore incomplete, and the claim that cameras are “very successful” is not supported by the largely stable fatality figures. Focus on the supplied data and summarise the survey’s main findings.
Coherence and Cohesion: Band 5.5
The response has a recognisable sequence: it describes the two graphs, then discusses the survey topics, and ends with a conclusion. Paragraph breaks help separate these stages, and linking expressions such as “similarly” and “in conclusion” make the progression visible. However, the organisation is weakened because the survey discussion is presented as personal opinion rather than as a report of the table data, so the reader cannot follow the actual evidence. Some references are also unclear, as in “All the trends fluctuate,” which does not specify which series is meant. Build a clearer overview first, then group the graph trends and survey results into separate, logically connected paragraphs.
Lexical Resource: Band 5.5
The response uses some relevant topic vocabulary, including “fatalities,” “fluctuate,” “installation” and “over speeders,” and the general meaning is usually understandable. However, vocabulary is often imprecise or repetitive: “trends” and “graph” recur frequently, while “the casualities remain contant” is not an accurate or clear description of the data. There are also noticeable spelling errors, including “realted,” “answere,” “successfull” and “unforscene,” which reduce the accuracy of the report. Use precise terms for the figures and survey responses, and check spelling carefully. More formal reporting language would also help distinguish observed data from personal views.
Grammatical Range and Accuracy: Band 5.0
The response attempts a mixture of simple statements and longer sentences, including a contrast introduced by “however,” but control is inconsistent. Errors in sentence structure and agreement appear in phrases such as “the answer to the question that if the speed cameras helped reducing,” “there is not information is provided,” and “installing speed cameras on the roads in a very wise decision.” These constructions make parts of the report difficult to follow. There are also problems with articles, plurals and punctuation, for example “in 1st year” and the run-on structure around “however it became easier.” Aim for direct, complete sentences with a clear subject and verb, and use past or present tense consistently when describing the chart.
See this exact question answered at other band scores. The same prompt compared across bands.
Browse more IELTS Writing model answers or get your own writing scored by the same AI examiner.