Band 5.5 IELTS Writing Task 1 Model Answer
Overall Band Score: 5.5 · IELTS Complete Catalyst · 2026-11-12
IELTS Writing Task 1 question
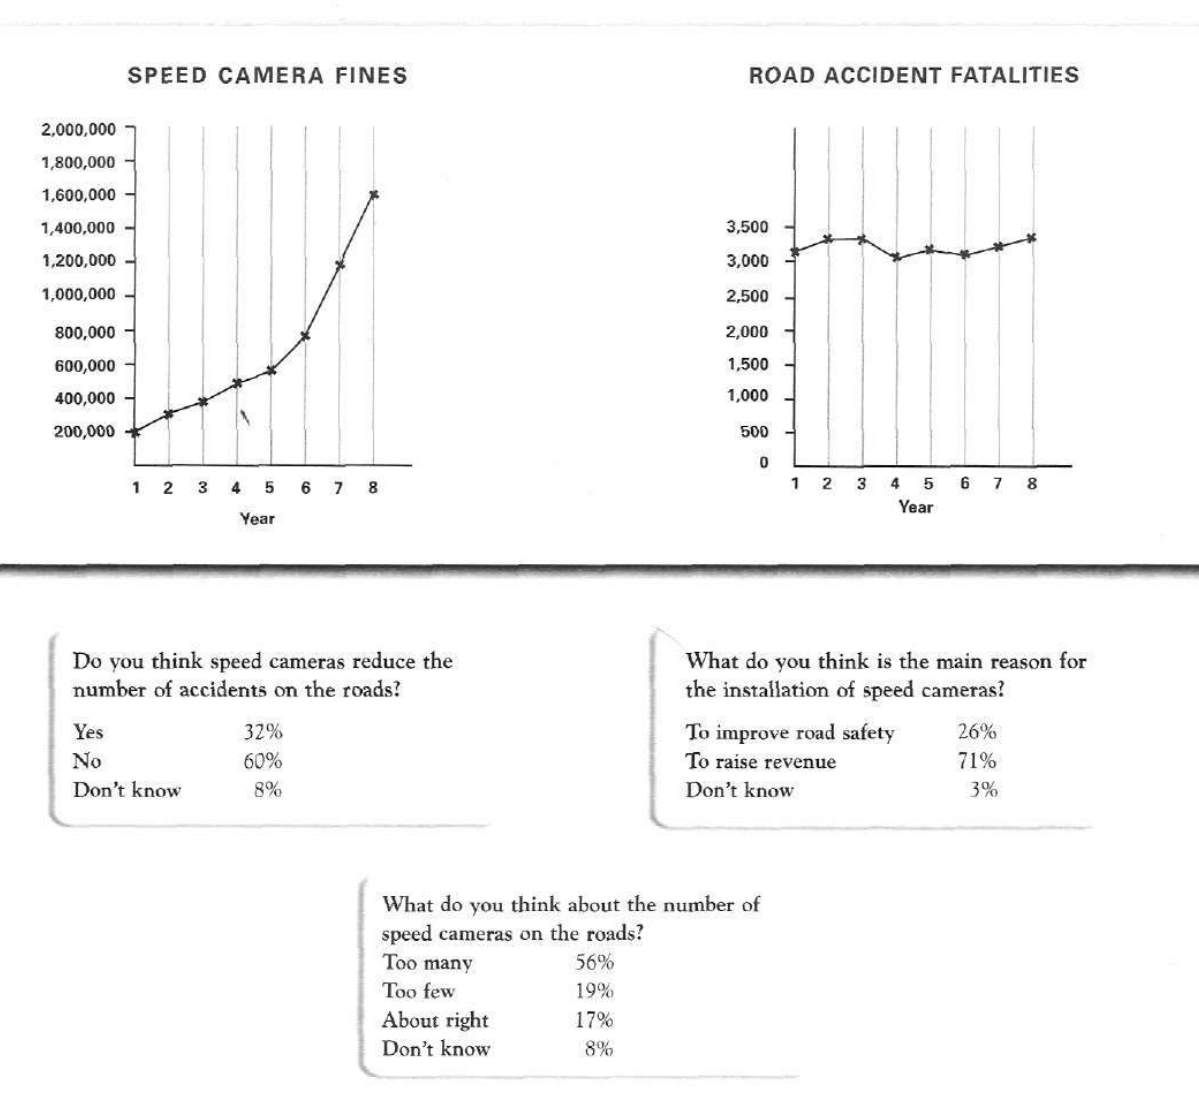
The graphs below show the number of drivers in Britain who have been caught driving too fast by speed cameras placed on roads, and the number of people killed in road accidents, over an eight-year period since the introduction of speed cameras. The tables show the results of a survey on people's opinions on speed cameras.
Write a report for a university lecturer describing the information below.
SPEED CAMERA FINES and ROAD ACCIDENT FATALITIES
Student answer (Band 5.5)
The line graphs illustrate people are caught by over speeding, detect by cameras and also shows the death occurs on road in 8 years of time when camera introduce.
Overall, the graph of fines were rose as the period of time, where as road accident number was fluctuate. Survey was also held for accident, road safety and number of camera were there on road by local people.
For, speed camera fines has initially around [redacted phone] and raise upto to eight times to approximately [redacted phone] by the end of the period. The road accident fatalities fluctuate between 3000, with some ups and down.
Government took survey on local people and aware of basic safety and facillites- speed camera reduce the number of accident on the road and majority disagree with this is around 60%, and installtion of cameras is highest for raise revenue with 71% and safety 26%, and most of think that there are too many speed cameras on the road is around 56% and some of them agree and less amount of people are not aware of this
AI examiner evaluation
| Criterion | Band |
|---|---|
| Task Achievement / Task Response | 6.0 |
| Coherence and Cohesion | 5.5 |
| Lexical Resource | 5.0 |
| Grammatical Range and Accuracy | 4.5 |
| Overall | 5.5 |
Task Achievement / Task Response: Band 6.0
You cover both the graphs and the survey, and your overview identifies the main contrast: fines rose while fatalities fluctuated. You also report the key survey findings that 60% did not think cameras reduce accidents, 71% saw revenue as the main reason for installation, and 56% thought there were too many cameras. These are relevant and broadly accurate. However, some details are unclear or imprecise: fatalities are described as fluctuating “between 3000,” without explaining that they stayed roughly within 3,100–3,350, and “raise upto to eight times” is not a clear comparison. The survey’s other responses receive little attention, and the introduction does not clearly describe the period or what the graphs measure. Select and explain the main figures more precisely.
Coherence and Cohesion: Band 5.5
The response has a recognisable sequence: an introduction, an overview, graph details, and then survey results. This gives it an overall structure, and phrases such as “Overall” and “by the end of the period” help signal relationships. However, progression within paragraphs is uneven. The final paragraph combines several survey questions in one long sentence, making the comparisons difficult to follow, while “For,” at the start of the graph-detail paragraph is an awkward transition. Some references are also unclear, such as “some of them agree” and “less amount of people,” because the reader must infer which survey response is meant. Separate the survey findings into clearer sentences and use explicit links such as “By contrast” or “Regarding the number of cameras.”
Lexical Resource: Band 5.0
You use some relevant task vocabulary, including “fines,” “fatalities,” “fluctuate,” “revenue,” and “road safety,” so the topic is generally understandable. However, the range is limited and several word choices or collocations are inaccurate, which sometimes makes the meaning unclear. For example, “people are caught by over speeding” and “the death occurs on road” do not express the chart categories naturally; “fines has initially” also uses an unsuitable form. Spelling errors such as “facillites” and “installtion” further reduce accuracy. Aim for precise chart language and check word forms and spelling. For instance, describe the number of drivers “caught speeding” and the number of “road fatalities.”
Grammatical Range and Accuracy: Band 4.5
You attempt both simple and more extended sentence forms, including a contrast in “the graph of fines … whereas road accident number was fluctuate.” However, errors in verb forms, agreement, articles, and sentence construction are frequent enough to make several statements difficult to read. Examples include “fines were rose,” “number was fluctuate,” and “when camera introduce”; these need forms such as “fines rose,” “the number fluctuated,” and “when cameras were introduced.” The final sentence also runs together several ideas without clear grammatical boundaries. Build accuracy first with complete, controlled sentences, then add complex clauses using “while,” “whereas,” or “although.” Check subject–verb agreement and past-tense forms throughout.
See this exact question answered at other band scores. The same prompt compared across bands.
Browse more IELTS Writing model answers or get your own writing scored by the same AI examiner.