Band 6.0 IELTS Writing Task 1 Model Answer
Overall Band Score: 6.0 · IELTS Complete Catalyst · 2026-11-12
IELTS Writing Task 1 question
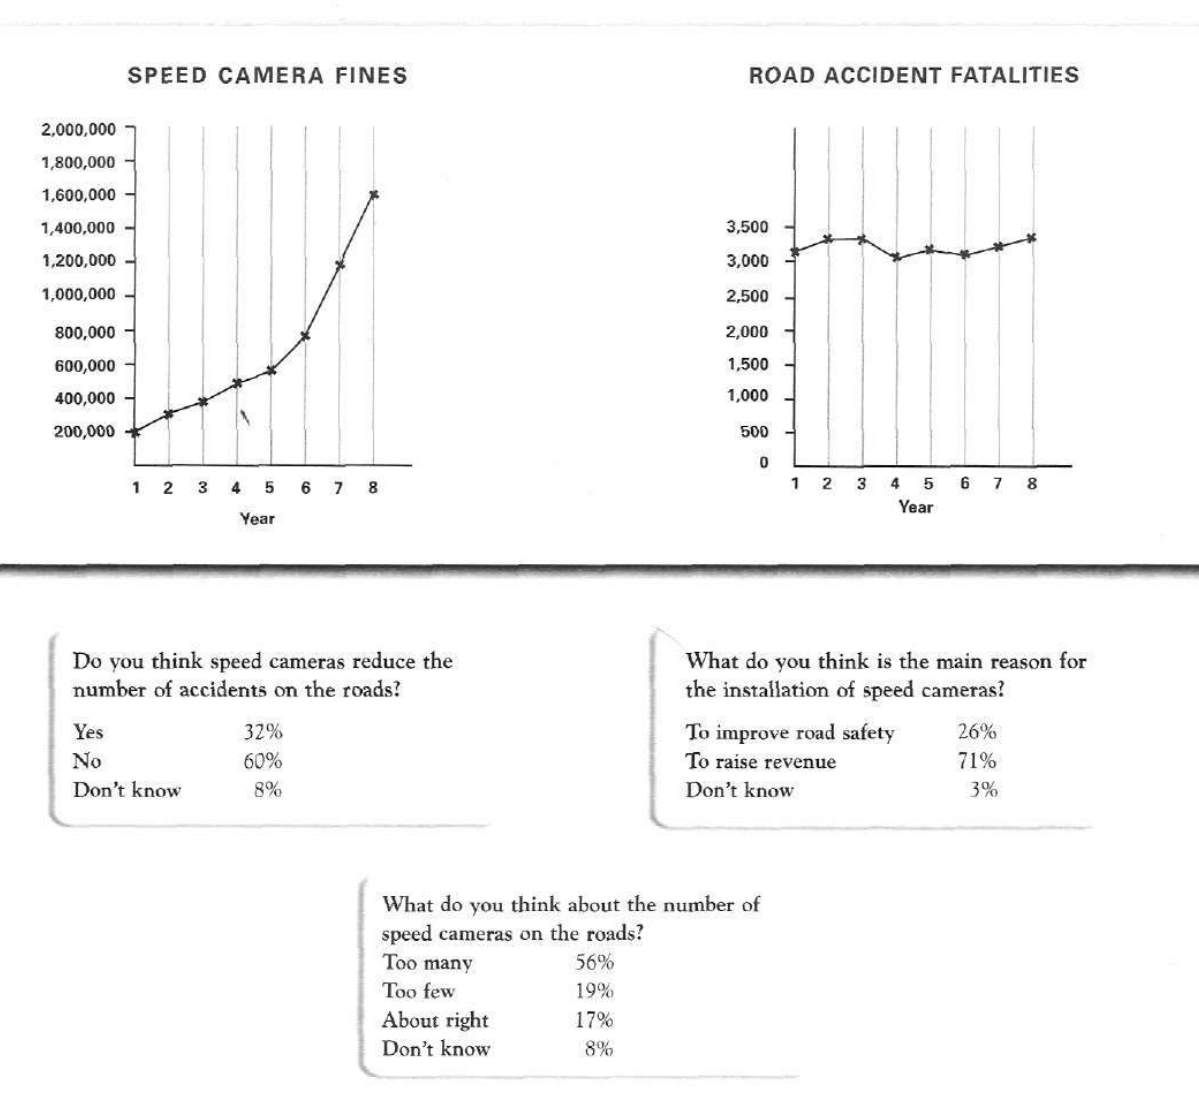
The graphs below show the number of drivers in Britain who have been caught driving too fast by speed cameras placed on roads, and the number of people killed in road accidents, over an eight-year period since the introduction of speed cameras. The tables show the results of a survey on people's opinions on speed cameras.
Write a report for a university lecturer describing the information below.
SPEED CAMERA FINES and ROAD ACCIDENT FATALITIES
Student answer (Band 6.0)
The line graphs trace the number of drivers in Britain who has to pay fine after being caught by speed camera and the number people died in road accidents, over an eight-year period since the speed cameras are introduced. The table illustrates the people's response about speed cameras.
Overall, since the introduction of the speed cameras, the number of people getting fine has surged while the road accidents fatalities have fluctuated by small percent over the period. Most of the individuals think that cameras has not reduced the number of accidents and main purpose of the installtion was to raise revenue.
On the one hand, drivers who have been caught driving too fast were 200,000 in the first year of the introduction of the camera, it increased significantly to around 1,600,000 people after 8 years. Meanwhile, the road accidents were just over 3000 in the first year, it fluctuated over the years but has maintained to stay under 3500 after 8 years.
On the other hand, more than half the population thinks that speed camers has not reduced the accidents , the main reason for the installation was to raise revenue and there are too many cameras, while less that 10% people have no opinion.
AI examiner evaluation
| Criterion | Band |
|---|---|
| Task Achievement / Task Response | 6.5 |
| Coherence and Cohesion | 6.5 |
| Lexical Resource | 5.5 |
| Grammatical Range and Accuracy | 5.5 |
| Overall | 6.0 |
Task Achievement / Task Response: Band 6.5
The report covers both graphs and the survey, and its overview identifies the main contrast: fines rose sharply while fatalities changed only slightly. It also correctly highlights that most respondents believed cameras did not reduce accidents and were installed to raise revenue. The figures of 200,000 and 1.6 million for fines are accurate, as is the general description of fatalities remaining below 3,500. However, some details are less fully reported: the fatalities actually end at about 3,350, and the survey’s 56% who said there were too many cameras is not quantified. “Less than 10%” refers only to respondents with no opinion, rather than capturing the other survey responses. More precise comparisons and selected percentages would strengthen coverage.
Coherence and Cohesion: Band 6.5
The response has a clear overall arrangement: an introduction, an overview, a paragraph about the graphs and a final paragraph on the survey. This gives the reader a logical route through the information, and phrases such as “Overall” and “Meanwhile” help signal relationships. The progression is generally easy to follow, though “On the one hand” and “On the other hand” are not especially suitable for separating the graph data from the survey, since these are categories of information rather than opposing arguments. The final paragraph also compresses several survey findings into one sentence, making the comparisons less clear. Grouping the survey results more explicitly and using precise links between figures would make cohesion more flexible and less formulaic.
Lexical Resource: Band 5.5
The response uses some appropriate task vocabulary, including “fluctuated,” “significantly,” “installation” and “revenue,” and the main trends remain understandable. However, word choice and collocation are often imprecise: “getting fine” and “pay fine” are unnatural, while “the number of people getting fine has surged” is less precise than describing the number of fines or drivers caught. There are also spelling errors in “installtion” and “camers,” and “less that 10% people” is awkwardly expressed. Repetition of “number” and “people” limits flexibility. Aim for accurate chart language such as “the number of speeding drivers fined” and “respondents,” and check spelling and countable/uncountable forms.
Grammatical Range and Accuracy: Band 5.5
There is an attempt to use both simple and complex structures, including clauses with “while” and “since,” and the overall meaning is usually clear. However, some grammatical errors recur. In the opening, “drivers … who has to pay” has incorrect subject–verb agreement, and “the number people died” is missing a grammatical link. The phrase “since the speed cameras are introduced” uses an unsuitable tense, while “cameras has not reduced” again has agreement error. Several sentences join independent clauses with commas, for example, “it increased significantly …, it fluctuated over the years,” which weakens punctuation and sentence control. Review agreement, article use and tense consistency, and separate or correctly link clauses. More consistently accurate complex sentences would improve control.
See this exact question answered at other band scores. The same prompt compared across bands.
Browse more IELTS Writing model answers or get your own writing scored by the same AI examiner.