Band 5.5 IELTS Writing Task 1 Model Answer
Overall Band Score: 5.5 · IELTS Complete Catalyst · 2026-11-15
IELTS Writing Task 1 question
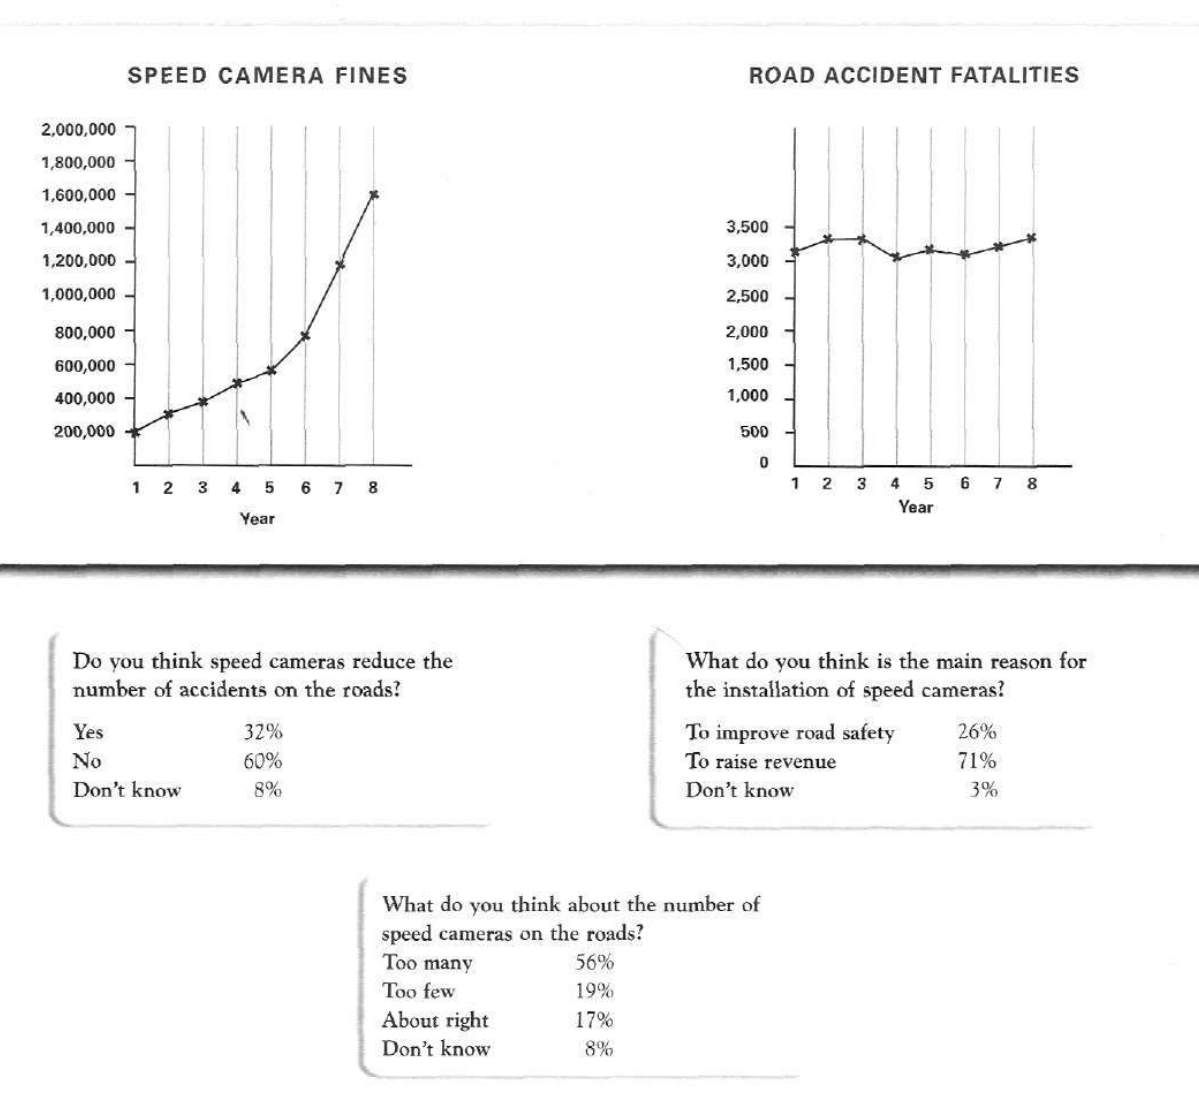
The graphs below show the number of drivers in Britain who have been caught driving too fast by speed cameras placed on roads, and the number of people killed in road accidents, over an eight-year period since the introduction of speed cameras. The tables show the results of a survey on people's opinions on speed cameras.
Write a report for a university lecturer describing the information below.
SPEED CAMERA FINES and ROAD ACCIDENT FATALITIES
Student answer (Band 5.5)
The tableshown describes the results of surevy that include the drivers in Britian who are fined for dirving too fast on the roads as they were caught by speed cameras and also the number of people killed due to road accidents.
As the graph illustrates that the speed camera fines are increasing exponentially every year. This is due to the price decrese in the cars and more advanced speed camera technology. In year 1,2,3,4 and 5 there is a linear increase in speed camera fines as population is increasing every year too. But in year 6 to 7 and then 7 to 8, there shows a drastic increase in speed fines reaching the figure from 800,000 to 1,600,000.
On the other hand, deaths reported due to overspeeding was on average 3200 every year. Year 4 has recorded the lowest death count of 3100 while the year 2,3 and 8 has recored the heighest of around 3400.
More following questions were asked from poeple:
1:Do you think speed cameras reduce number of road accidents? 32% said yes while 60% people denied it.
2: The main reason of installation of speed cameras were asked? 26% said to improve safety while 71% said to raise revenue.
3: Majority of people (around 56%) said people there are too many speed cameras on road.
AI examiner evaluation
| Criterion | Band |
|---|---|
| Task Achievement / Task Response | 5.5 |
| Coherence and Cohesion | 5.5 |
| Lexical Resource | 5.5 |
| Grammatical Range and Accuracy | 5.0 |
| Overall | 5.5 |
Task Achievement / Task Response: Band 5.5
You cover both the charts and the survey, and identify the broad contrast between rising fines and relatively stable fatalities. However, some key details are inaccurate or unsupported: fines rise steadily rather than “exponentially,” and the explanation about cheaper cars, population growth and improved camera technology is not shown in the data. Fatalities peak at about 3,350 in year 8, not around 3,400 in years 2, 3 and 8; year 4 is the low point, but year 6 is also about 3,100. The survey’s third result is only partly reported: include the 19% who said there were too few and 17% who thought the number was about right. A clearer overview and more accurate selection of figures would strengthen the report.
Coherence and Cohesion: Band 5.5
The response has a recognisable sequence: it introduces the visuals, discusses fines, then fatalities, and finally the survey. This gives the reader a basic structure, and transitions such as “On the other hand” help signal a change of focus. However, the progression is weakened by presenting the survey as numbered questions rather than integrating the results into a concise report, and the opening does not clearly distinguish the charts from the survey tables. Some links are awkward or unclear, such as “As the graph illustrates that” and “More following questions were asked from poeple.” Use separate, purposeful paragraphs for the overview, chart trends and survey findings, with linking phrases that express comparisons accurately.
Lexical Resource: Band 5.5
You use some relevant task vocabulary, including “speed camera fines,” “drastic increase,” “death count” and “installation,” so the main subject is generally understandable. However, the range is limited and several choices are inaccurate or informal for an academic report. “Increasing exponentially” overstates the pattern, while “people denied it” is not a precise way to report survey responses. There are also noticeable spelling errors, including “surevy,” “Britian,” “dirving,” “decrese” and “recored,” which reduce the overall accuracy of the vocabulary. Aim for precise trend language and consistent formal phrasing, such as “rose steadily,” “respondents disagreed,” and “fatalities.” Proofreading spelling would also improve clarity.
Grammatical Range and Accuracy: Band 5.0
You attempt both simple and more complex sentences, but control is inconsistent, and errors occur often enough to make some sentences awkward. For example, “As the graph illustrates that” incorrectly combines two sentence patterns; write either “The graph illustrates that…” or “As the graph illustrates, …”. In “there shows a drastic increase,” the subject and verb construction is faulty, and “Year 4 has recorded” uses an unsuitable tense for describing completed chart data. The opening sentence also lacks clear grammatical structure, while the numbered survey questions contain incomplete or awkward constructions. Practise accurate past-tense reporting and straightforward clauses before adding complexity, and check articles, agreement and sentence boundaries.
See this exact question answered at other band scores. The same prompt compared across bands.
Browse more IELTS Writing model answers or get your own writing scored by the same AI examiner.