Band 4.5 IELTS Writing Task 1 Model Answer
Overall Band Score: 4.5 · IELTS Complete Catalyst · 2026-11-16
IELTS Writing Task 1 question
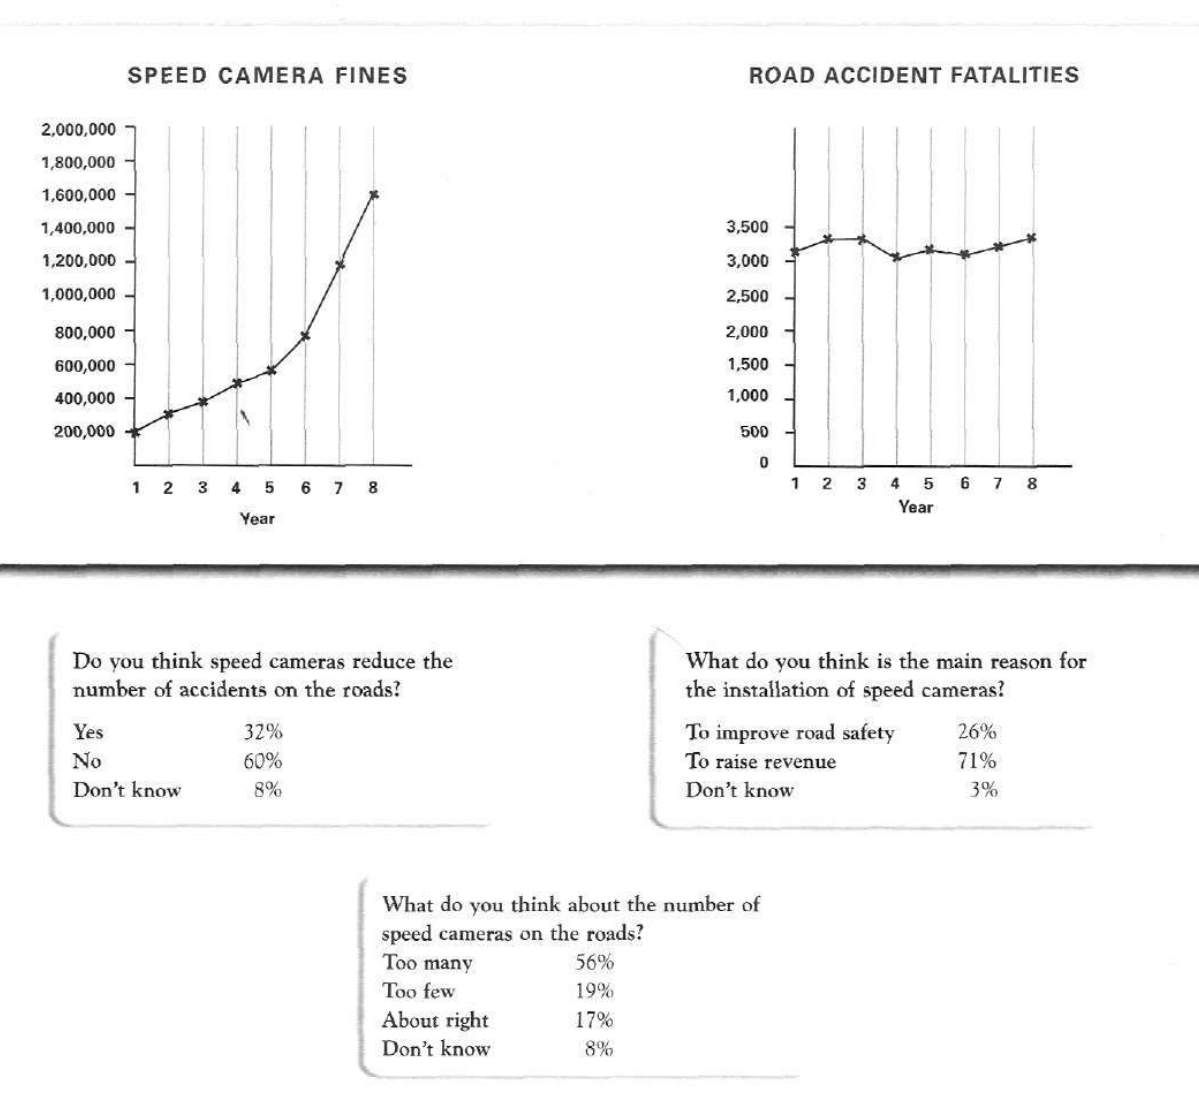
The graphs below show the number of drivers in Britain who have been caught driving too fast by speed cameras placed on roads, and the number of people killed in road accidents, over an eight-year period since the introduction of speed cameras. The tables show the results of a survey on people's opinions on speed cameras.
Write a report for a university lecturer describing the information below.
SPEED CAMERA FINES and ROAD ACCIDENT FATALITIES
Student answer (Band 4.5)
The graph illustrates the the information of Britain roads that how much drivers fined for overspeeding and how much peoples killed in road accidents over an eight years since the installation of the camera on the road.
However, In britain the speed camera fines gradually increases throughout the years. while accidents on road fluctuates their numbers in eight years. In two or three years highest accidents reported in which around about 3300 person were effected in Britain.
Morever, In Britain about [redacted phone] fined for overspeeding recorded that a huge number but fined for over speeding gradually increases throughout the whole time period and its highest peak are about [redacted phone] fines in eight years after the installation of the speed cameras on road. The road accidents in britain started from 3100 in the first year and then the numbers are liitle boost and its reached on its peak in second year in numbers are 3300 accidents were reported and then its number little decreased and in the end 3200 accidents were reported in the eight years.
In conclusion, the britain people breaks the rule of driving due to this they have a huge numbers in fines throughout the eight years and the numbers of accident in which almost 3000 peoples were killed in one year .the britain government made some stricts rules for britain people that they must follow to improve the credibility of roads .
AI examiner evaluation
| Criterion | Band |
|---|---|
| Task Achievement / Task Response | 3.5 |
| Coherence and Cohesion | 5.0 |
| Lexical Resource | 5.0 |
| Grammatical Range and Accuracy | 5.0 |
| Overall | 4.5 |
Task Achievement / Task Response: Band 3.5
The response identifies the two chart topics and reports the broad contrast: fines rise substantially, while fatalities fluctuate. It also includes some relevant figures, such as fines increasing from about 200,000 to 1.6 million and fatalities reaching roughly 3,300. However, it only partially covers the task: all three survey tables are omitted, and there is no clear overview bringing together the main findings. Several details are inaccurate or confusing: fatalities begin at about 3,150, not 3,100, and the final figure is about 3,350, not 3,200; the claim that the second year was the peak also overlooks the equal figure in year three. The conclusion adds unsupported claims about rule-breaking and government rules. Select and compare the key chart and survey results, and avoid speculation.
Coherence and Cohesion: Band 5.0
The response has a basic paragraph structure, moving from an introduction to chart details and then a conclusion, and words such as “However,” “Moreover,” and “In conclusion” signal intended connections. This gives the reader some organisation. However, progression is not consistently clear: the second paragraph introduces trends, while the next repeats and expands them without a distinct comparison or grouping. Some linking words do not express the relationship accurately, and references such as “its number” and “their numbers” are unclear. The conclusion shifts from describing data to making recommendations, which weakens the report’s focus. Group the information into clear sections—for example, the two chart trends and then the survey results—and use precise references and transitions to show how the figures relate.
Lexical Resource: Band 5.0
The response uses some task-related vocabulary, including “speed camera fines,” “fluctuates,” “installation,” and “peak,” so the reader can generally identify the subject. However, the range is limited and several word choices or collocations are inaccurate or awkward, sometimes making the meaning difficult to follow. Examples include “how much peoples killed,” “fined for overspeeding,” “highest peak,” and “improve the credibility of roads.” Spelling and word-form errors such as “Morever,” “liitle,” and “stricts” are also noticeable. Aim for precise, conventional language for describing data, such as “the number of fatalities,” “rose steadily,” and “reached a high of.” Check spelling and use “people” rather than “peoples” in this context.
Grammatical Range and Accuracy: Band 5.0
There are attempts to combine ideas using clauses and time expressions, for example, “fines gradually increases throughout the years, while accidents on road fluctuates.” This shows some effort to move beyond isolated simple sentences. However, complex sentences are often faulty, and errors in agreement, articles, tense, and sentence boundaries occur frequently. For instance, “fines … increases” and “accidents … fluctuates” have incorrect subject–verb agreement, while “the graph illustrates the the information” has a duplicated article. The opening sentence is difficult to parse because its clauses are not joined correctly, and the final sentence runs together after “year.” Use shorter, controlled sentences first, check singular and plural subjects, and punctuate each complete idea clearly before attempting longer structures.
See this exact question answered at other band scores. The same prompt compared across bands.
Browse more IELTS Writing model answers or get your own writing scored by the same AI examiner.