Band 5.5 IELTS Writing Task 1 Model Answer
Overall Band Score: 5.5 · IELTS Complete Catalyst · 2026-11-16
IELTS Writing Task 1 question
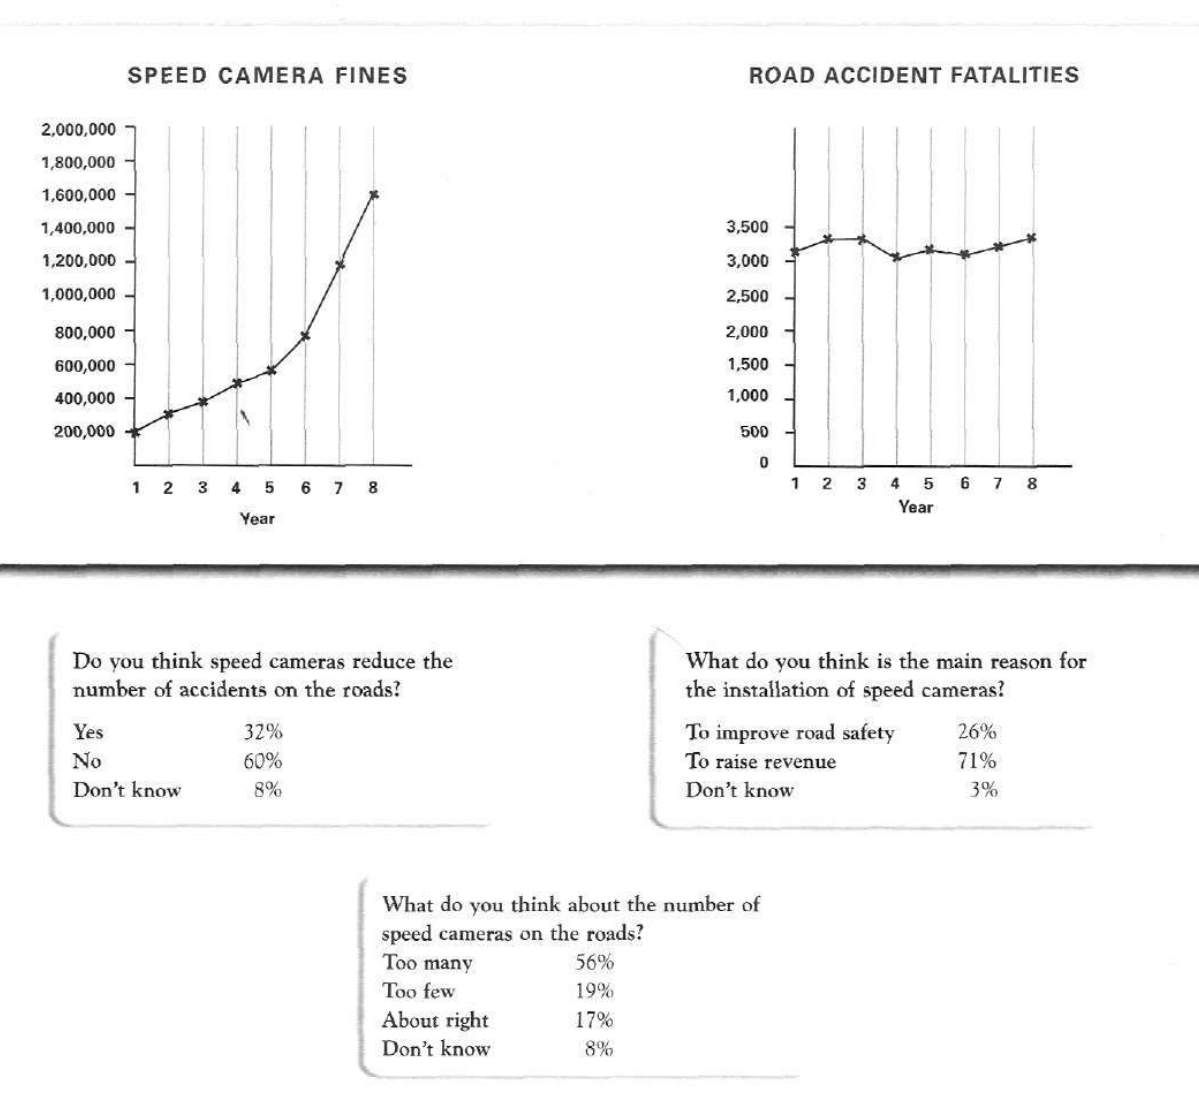
The graphs below show the number of drivers in Britain who have been caught driving too fast by speed cameras placed on roads, and the number of people killed in road accidents, over an eight-year period since the introduction of speed cameras. The tables show the results of a survey on people's opinions on speed cameras.
Write a report for a university lecturer describing the information below.
SPEED CAMERA FINES and ROAD ACCIDENT FATALITIES
Student answer (Band 5.5)
This graph illustrates the period of eight years after the introduction of speed cameras and number of drivers in Britain which drive too fast and got caught through the speed cameras which are placed on roads also the number of people which got killed in accidents
There is also a table of survey's results about people's opinions
Overall speed camera fines in the first year were less and around 200,000 it increased a little in the second year and keep increasing in every year in the third year it went up to 400,000 moreover in the sixth year camera fines were went up to around 700,000 and 800,000 however it kept getting more increased in every year and in the eighth year it went up to the highest point of 1,600,000 the last year was recorded the highest one for speed cameras fines
However for accidents it was started around 3100 which increased a little in every year until the fourth year which got decreased a little and went down until 3000 however it started increasing again with the same magnitudes and went up to between 3300 until the last year
For the survey people had different opinions about if the speed cameras reduce the number of accidents or not
60% said No 32% said Yes and the remaining 8% opted for don't know
There is another survey about the main reason for installation of speed cameras in which 71% said they got installed because to raise revenue other 26% said to improve road safety and the remaining 3% were clueless and said don't know
AI examiner evaluation
| Criterion | Band |
|---|---|
| Task Achievement / Task Response | 5.5 |
| Coherence and Cohesion | 5.5 |
| Lexical Resource | 5.0 |
| Grammatical Range and Accuracy | 5.0 |
| Overall | 5.5 |
Task Achievement / Task Response: Band 5.5
You cover the main chart and two of the three survey questions, and several figures are broadly accurate: fines rise from about 200,000 to 1.6 million, while 60% say cameras do not reduce accidents and 71% believe revenue is the main reason for installation. However, the report omits the survey about the number of cameras, an important part of the task. Some chart details are also imprecise: fines in year three are about 380,000, not 400,000, and fatalities fluctuate rather than increasing steadily until year four. The overview is not clearly separated from the details, and the key message that fatalities remain broadly stable while fines rise sharply is not stated directly. Include all three survey results and summarise the main contrast accurately.
Coherence and Cohesion: Band 5.5
The response has a recognisable sequence: it introduces the visuals, describes fines, then fatalities, and finally reports survey findings. This gives the reader some organisation. However, progression is weakened by long, loosely connected sentences, especially the paragraph beginning “Overall speed camera fines…” where several years and changes are joined together. Linking words such as “however” and “moreover” are repeated or do not always show a clear contrast. The survey section also ends without covering the final question, so the report feels incomplete. Use separate, clearly focused paragraphs for the overview, chart details, and survey results; within each, group related information and use concise comparisons rather than chaining every point together.
Lexical Resource: Band 5.0
You use relevant topic vocabulary, including “speed camera fines,” “road safety,” “raise revenue,” and “accidents,” so the subject is generally clear. However, the range is limited and several phrases are awkward or repetitive, such as “got caught through the speed cameras,” “keep increasing,” and “went up to the highest point.” Some word choices also make the meaning less precise: “the same magnitudes” does not clearly describe the small fluctuations in fatalities, and “clueless” is too informal for an academic report. Aim for accurate chart language and a more formal register, using terms such as “rose,” “remained broadly stable,” and “respondents were unsure.” This would make the description more concise and precise.
Grammatical Range and Accuracy: Band 5.0
The response attempts longer sentences and uses some time clauses, but complex structures are often faulty, and many sentences lack reliable control of tense, agreement, articles, or punctuation. For example, “it increased a little … and keep increasing” shifts tense, while “camera fines were went up” combines incompatible verb forms. The opening sentence is a fragment-like run-on, and “There is also a table of survey's results” has an incorrect possessive construction. These errors sometimes make relationships between events difficult to follow. Practise writing shorter, complete sentences with consistent past tense for the historical data, then add controlled comparisons using clauses such as “while” or “whereas.” Check verb forms and sentence boundaries during revision.
See this exact question answered at other band scores. The same prompt compared across bands.
Browse more IELTS Writing model answers or get your own writing scored by the same AI examiner.