Band 5.0 IELTS Writing Task 1 Model Answer
Overall Band Score: 5.0 · IELTS Complete Catalyst · 2026-11-17
IELTS Writing Task 1 question
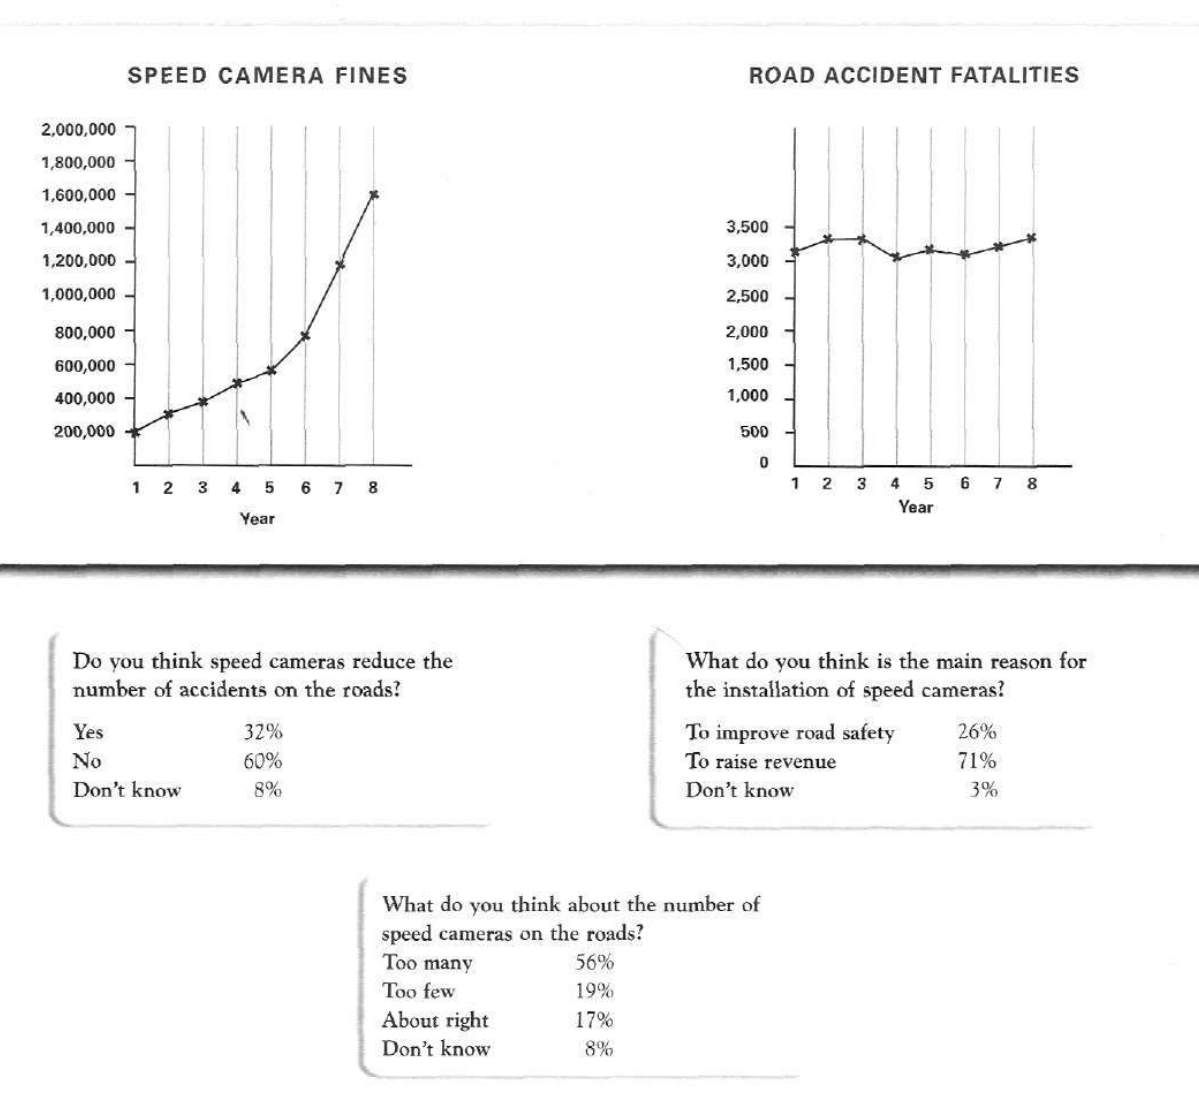
The graphs below show the number of drivers in Britain who have been caught driving too fast by speed cameras placed on roads, and the number of people killed in road accidents, over an eight-year period since the introduction of speed cameras. The tables show the results of a survey on people's opinions on speed cameras.
Write a report for a university lecturer describing the information below.
SPEED CAMERA FINES and ROAD ACCIDENT FATALITIES
Student answer (Band 5.0)
Here we have given two line graph the first one illustrates the drivers how have done over-speeding on road. All the figures are measured in year. Were second line graph illustrate the number of accident have done . All the figures are taken in year.
Form the graph we can conclude that the speed camara fines are still significantly increase as the year passes. And accident remain constant threw out the same period of time.
The speed camara fine reaching its top in year 8 in which around 1,600,000 people are caught. From year 1 to 5 the speed five increase slowly but after 5th year the increase significantly. The road accident remain almost constant threw out the year 1 to 8 , Which is around 3000 people. The road accident are minimum in the forth year.
There is also data has given that Many Britain people think that speed camaras cannot reduce the number of accidents on the roads. The also think that the number of speed cameras on road are too many and seed cameras are for to improve the safty of the road.
AI examiner evaluation
| Criterion | Band |
|---|---|
| Task Achievement / Task Response | 5.5 |
| Coherence and Cohesion | 5.5 |
| Lexical Resource | 5.0 |
| Grammatical Range and Accuracy | 4.5 |
| Overall | 5.0 |
Task Achievement / Task Response: Band 5.5
You identify the main contrast in the charts: fines rise substantially, while fatalities remain broadly stable. You also include some relevant figures, such as about 1.6 million fines in year 8, and note that fatalities are lowest in year 4. However, the report only partially covers the survey: it mentions that many people doubt cameras reduce accidents and think there are too many, but omits the key percentages and gives a contradictory final claim that people think cameras are for improving safety. In fact, 71% selected raising revenue, compared with 26% for road safety. Develop the overview and report the survey’s main results accurately to make the response more complete.
Coherence and Cohesion: Band 5.5
The response has a basic overall structure, moving from an introduction to the chart trends and then to the survey, and phrases such as “From the graph” and “From year 1 to 5” help signal the topic. However, progression is uneven: the opening repeats that the figures are measured by year, and the survey information is compressed into one unclear final sentence. Some links are mechanical or inaccurate, including “And accident remain constant” and “There is also data has given.” Use separate, clearly focused paragraphs for the overview, chart details and survey findings, and connect each point with precise references so the reader can follow the comparisons more easily.
Lexical Resource: Band 5.0
You use some relevant task vocabulary, including “line graph,” “remain constant,” “increase,” and “minimum,” so the main trends can be understood. However, the range is limited and several word choices or collocations are inaccurate, such as “speed camara fines,” “the speed five increase,” and “accident have done.” Repetition of “year,” “increase,” and “road accident” also makes the report less precise. Spelling errors such as “threw,” “camaras,” and “safty” are noticeable. Build a more accurate set of chart-reporting expressions, for example “the number of fines rose,” “fatalities fluctuated,” and “respondents believed,” and check spelling before submitting.
Grammatical Range and Accuracy: Band 4.5
The response attempts both simple statements and longer sentences, and the main trend is sometimes conveyed clearly, as in “The road accident remain almost constant.” However, grammatical errors are frequent and can make relationships difficult to understand. Examples include “Here we have given two line graph,” “the drivers how have done over-speeding,” and “There is also data has given.” Subject–verb agreement, articles, plurals and verb forms are often inaccurate, as in “accident remain” and “the speed camara fine reaching.” Sentence boundaries and capitalization are also inconsistent. Practise accurate basic sentence patterns first, then add subordinate clauses; for example, “The number of fines rose sharply after year 5, whereas fatalities fluctuated around 3,000.”
See this exact question answered at other band scores. The same prompt compared across bands.
Browse more IELTS Writing model answers or get your own writing scored by the same AI examiner.