Band 5.0 IELTS Writing Task 1 Model Answer
Overall Band Score: 5.0 · IELTS Complete Catalyst · 2026-11-17
IELTS Writing Task 1 question
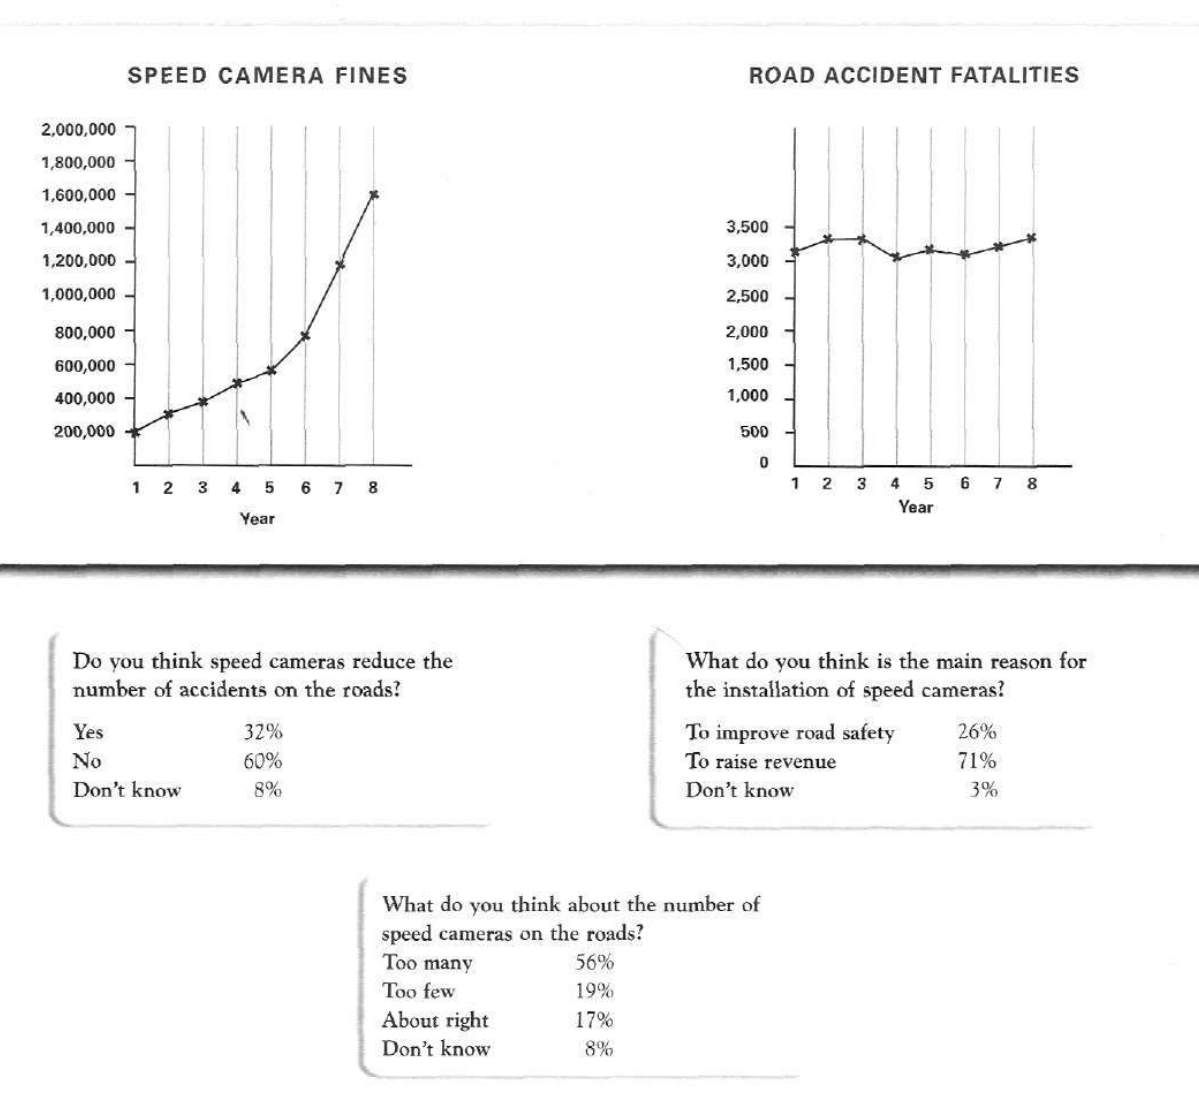
The graphs below show the number of drivers in Britain who have been caught driving too fast by speed cameras placed on roads, and the number of people killed in road accidents, over an eight-year period since the introduction of speed cameras. The tables show the results of a survey on people's opinions on speed cameras.
Write a report for a university lecturer describing the information below.
SPEED CAMERA FINES and ROAD ACCIDENT FATALITIES
Student answer (Band 5.0)
According to the illustration and charts , its showing the survey on people's opinion on speed cameras and chart is specifically showing the rate of road accidents and fines over eight year period since the introduction of speed cameras. so primarily looking to the first chart of speed camera fines its shows the increase in fine over eight years after installing speed cameras while the second chart shows the road accident fatalities that remain approximately constant throughout these years and then comes the survey of people related about speed cameras and accident ratios , so the fisrt survey was taken and question was asked does the speed cameras reduce the number of accidents on the road? and the result or comeout was obvious majorly voting on NO which was around 60 percent and then 32 percent people thought it does reduce the number of accidents and then percent of people where neutral the next question was about the main reason for the installation of speed cameras where majority votes where for rasing revenue from the fines, 26 percent voted forthat it improves road safety and three percent were neutal and the last question was about what people think about the numbers of speed cameras on road so majority answered for too many option and 19 percent of them thought there are few cameras while other 17percent people were in a veiw of about right amount of them.
AI examiner evaluation
| Criterion | Band |
|---|---|
| Task Achievement / Task Response | 5.5 |
| Coherence and Cohesion | 4.5 |
| Lexical Resource | 5.0 |
| Grammatical Range and Accuracy | 4.5 |
| Overall | 5.0 |
Task Achievement / Task Response: Band 5.5
You identify the main overall patterns: fines rise over the period, while fatalities remain broadly stable, and you report the key survey result that 60% answered “No.” You also include most of the survey percentages accurately. However, the report is only partly developed: it gives no specific figures for the two chart trends, so the scale of the increase in fines and the fluctuations in fatalities are not clearly demonstrated. The final survey result is also incomplete: the 8% who did not know whether cameras reduce accidents is omitted, and the 8% who did not know how many cameras there should be is not mentioned. Add an overview and select key figures to support each main trend.
Coherence and Cohesion: Band 4.5
The response follows the broad order of the visual—first the charts, then the three survey questions—and uses some linking expressions such as “while,” “then,” and “the next question.” This gives the reader a basic route through the information. However, it is presented as one long paragraph, with several ideas joined into a single sentence by repeated “and then” phrasing. The opening is difficult to follow, and transitions such as “so primarily looking to” do not clearly signal the report’s structure. Separate the overview, chart details, and survey findings into paragraphs, and use concise links to show comparisons rather than narrating each question in sequence.
Lexical Resource: Band 5.0
You use some relevant vocabulary, including “road accident fatalities,” “approximately constant,” “majority,” and “installation,” so the topic is generally clear. However, the range is limited and several word choices or collocations are inaccurate or informal, such as “the result or comeout,” “voting on NO,” “raising revenue from the fines,” and “neutral.” Spelling errors—including “fisrt,” “rasing,” and “veiw”—also reduce accuracy. Aim for standard chart-report language and precise terms: for example, describe survey respondents as “answered no,” and say that fines “rose” or “increased.” Check spelling and avoid conversational phrasing so your vocabulary communicates the data more clearly.
Grammatical Range and Accuracy: Band 4.5
There are attempts to combine ideas using clauses, for example, “while the second chart shows…” and “where majority votes were…,” but sentence structures are often incomplete or run together. The opening, “According to the illustration and charts, its showing…,” has an unclear subject and faulty verb construction; later, “the first chart of speed camera fines its shows” repeats the subject and uses incorrect agreement. Missing articles and inconsistent sentence boundaries also occur, while commas are often used where full stops are needed. These errors make parts of the report difficult to read. Build shorter, complete sentences first, then add controlled complex structures, checking subject–verb agreement, articles, and punctuation.
See this exact question answered at other band scores. The same prompt compared across bands.
Browse more IELTS Writing model answers or get your own writing scored by the same AI examiner.