Band 4.5 IELTS Writing Task 1 Model Answer
Overall Band Score: 4.5 · IELTS Complete Catalyst · 2026-11-17
IELTS Writing Task 1 question
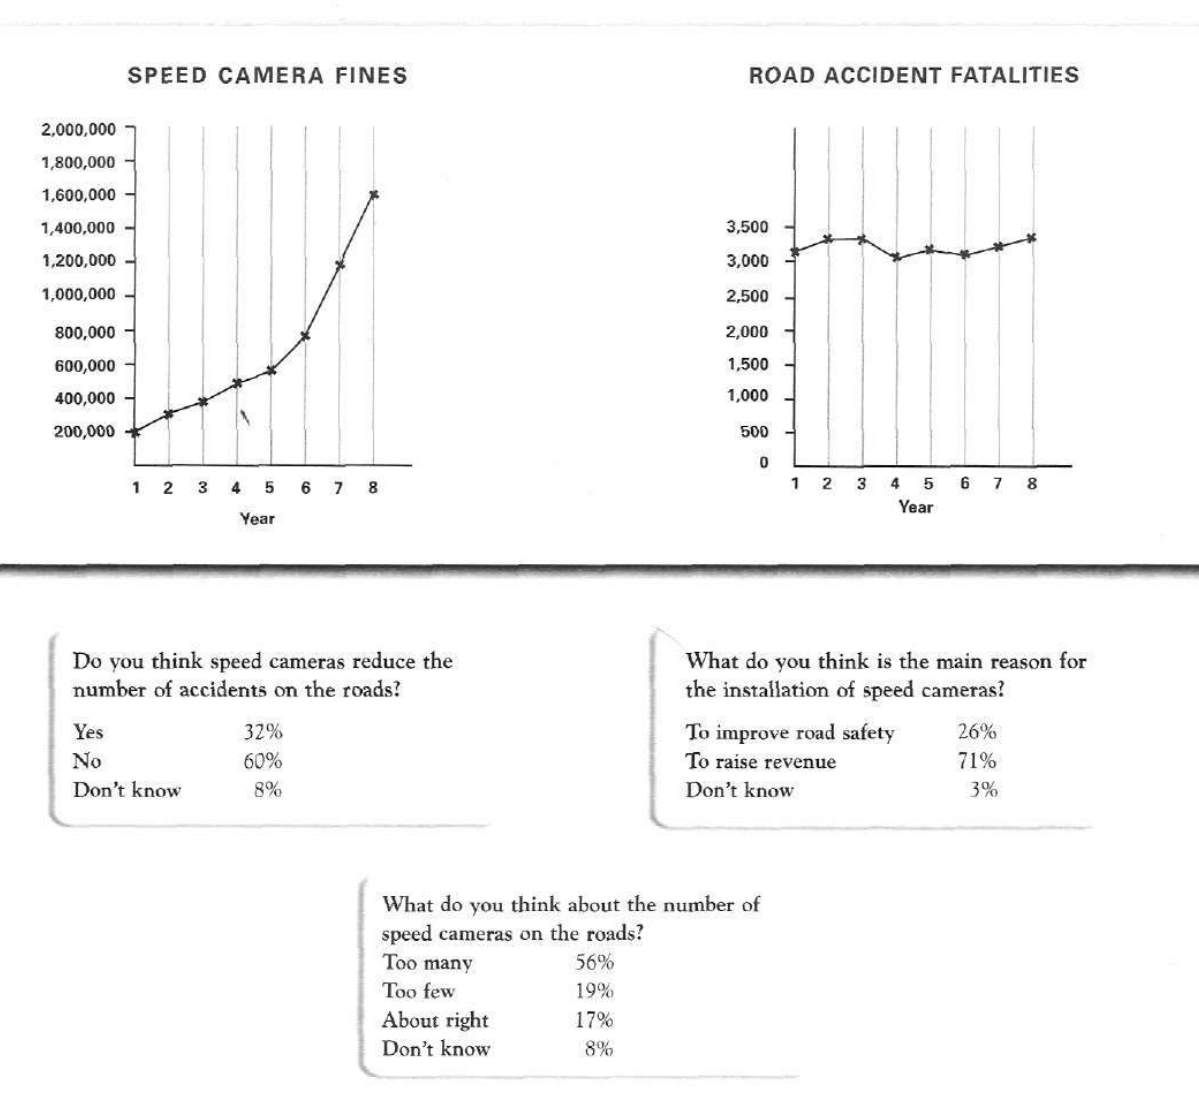
The graphs below show the number of drivers in Britain who have been caught driving too fast by speed cameras placed on roads, and the number of people killed in road accidents, over an eight-year period since the introduction of speed cameras. The tables show the results of a survey on people's opinions on speed cameras.
Write a report for a university lecturer describing the information below.
SPEED CAMERA FINES and ROAD ACCIDENT FATALITIES
Student answer (Band 4.5)
The given diagram provides the information about thr number of road accidents happend in britain at the time when the authorities are going to install speed cameras on streets and highways. It also shows the penality of people get cause of speed cameras in these eight years.
In the first year instalation of speed cameras in the the driver of britain got around 200 grands which becomes gradually increases innthe coming 5 years and reached to almost 5.50 lacs.At the time of sixth year the amount of fine raises suddenly which hits around 1,70,00,000 till the eighth year. On the other side the number of accidents does not have much impact in that time period and its stays between 3000 to 3500. The road accidents ration only fluctuates a little bit.
In the conclusion before installing speed cameras on streets and highways the laws have to make some stricts rules to obey traffic rules among the people and it should not be fined although the suspend their licensce as well as encourage them to use public transport services.
AI examiner evaluation
| Criterion | Band |
|---|---|
| Task Achievement / Task Response | 3.5 |
| Coherence and Cohesion | 5.0 |
| Lexical Resource | 4.5 |
| Grammatical Range and Accuracy | 5.0 |
| Overall | 4.5 |
Task Achievement / Task Response: Band 3.5
The response identifies the broad contrast between fines rising and fatalities fluctuating, which is relevant to the charts. However, it does not adequately report the full task: the three survey tables are omitted entirely, and there is no clear overview of the main findings across all visuals. Several figures are also inaccurate: fines reach about 1.6 million in year eight, not 1.7 million, and the response says they reach 550,000 by year five, whereas the chart shows about 580,000. The opening misrepresents the chart as showing accidents when cameras were being installed, and the final recommendations are not requested. To improve, summarise the key trends accurately and include the most notable survey results.
Coherence and Cohesion: Band 5.0
There is some basic organisation: the response begins with an introduction, then discusses fines and fatalities, and ends with a concluding paragraph. Linking phrases such as “On the other side” and “In the conclusion” help signal movement between ideas. However, progression is limited because the report does not group or compare all the information, particularly the survey results, and the final paragraph shifts to advice rather than summarising the data. Some references are unclear, as in “which becomes gradually increases” and “its stays between 3000 to 3500.” Use separate paragraphs for the overview, chart trends and survey findings, and connect comparisons with clear, accurate referencing.
Lexical Resource: Band 4.5
The response uses some task-related vocabulary, including “speed cameras,” “fine,” “fluctuates” and “road accidents,” so the topic is generally recognisable. However, word choice and spelling errors are frequent and sometimes make the meaning difficult to follow. Examples include “penality,” “happend,” “instalation,” “cause” for “because of,” and “accidents ration.” Informal or imprecise expressions such as “200 grands” and “5.50 lacs” are unsuitable for an academic report and may confuse readers; use standard numerical forms such as “200,000” and “550,000.” Build a more precise range for describing trends, such as “rose steadily,” “increased sharply” and “remained relatively stable.”
Grammatical Range and Accuracy: Band 5.0
The response attempts both simple and longer sentence forms, and the broad meaning of the main trends can usually be understood. However, control is inconsistent, especially in longer constructions. For example, “which becomes gradually increases” combines incompatible verb forms, while “the number of accidents does not have much impact … and its stays” has problems with agreement and sentence structure. Articles and repeated words are also problematic in “in the the driver,” and the final sentence is difficult to parse because several clauses are joined without clear grammatical relationships. Use shorter, complete sentences when reporting each trend, and check subject–verb agreement, verb tense and clause boundaries. More accurate sentence construction would make the data easier to interpret.
See this exact question answered at other band scores. The same prompt compared across bands.
Browse more IELTS Writing model answers or get your own writing scored by the same AI examiner.