Band 4.5 IELTS Writing Task 1 Model Answer
Overall Band Score: 4.5 · IELTS Complete Catalyst · 2026-11-18
IELTS Writing Task 1 question
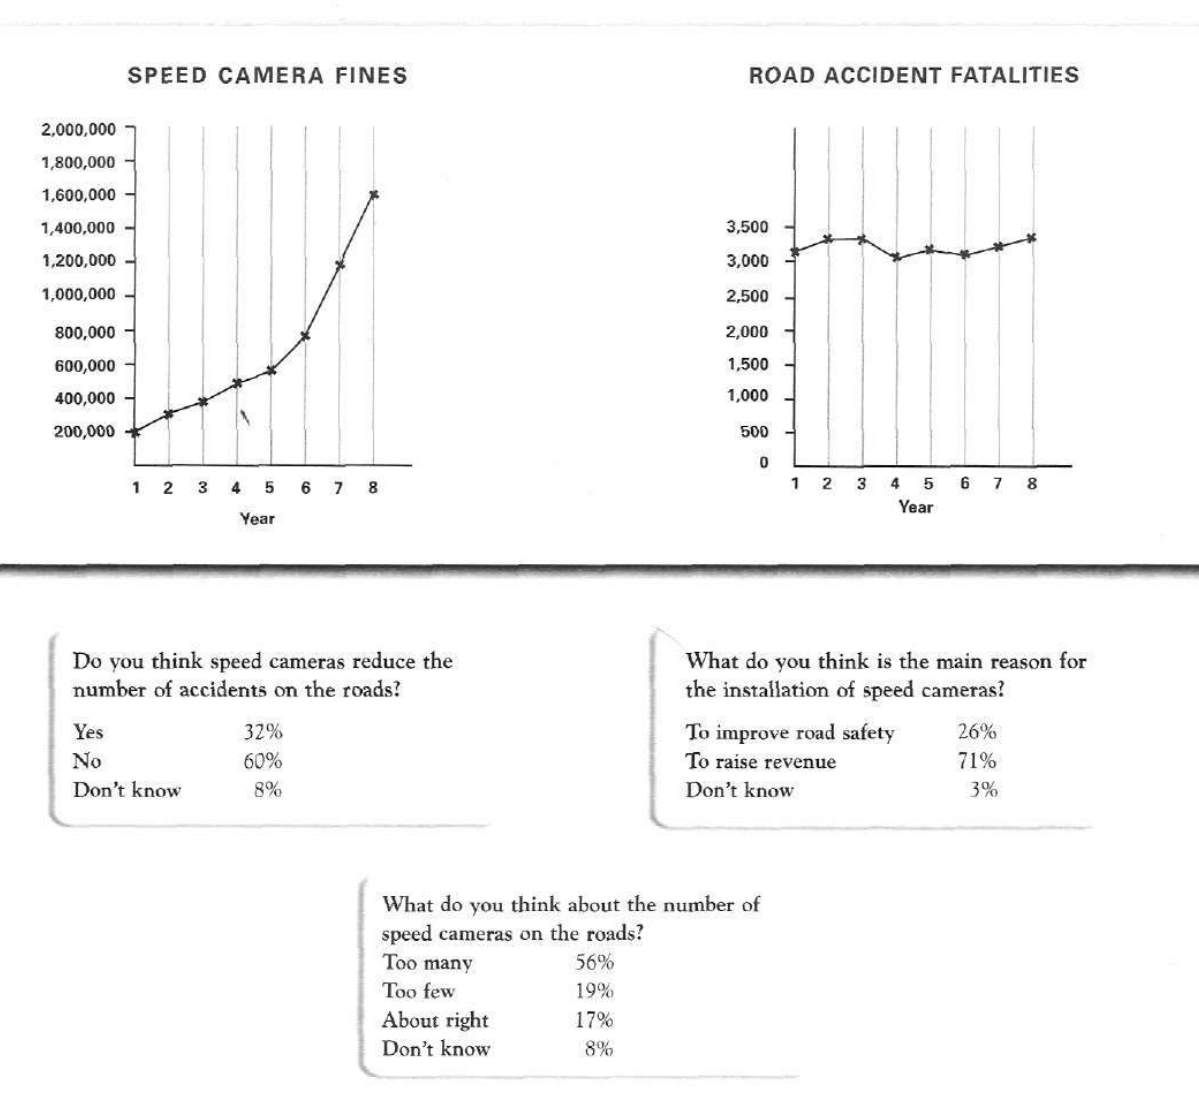
The graphs below show the number of drivers in Britain who have been caught driving too fast by speed cameras placed on roads, and the number of people killed in road accidents, over an eight-year period since the introduction of speed cameras. The tables show the results of a survey on people's opinions on speed cameras.
Write a report for a university lecturer describing the information below.
SPEED CAMERA FINES and ROAD ACCIDENT FATALITIES
Student answer (Band 4.5)
The line graphs compares the number of drivers in Britian who have been caught driving too fast by speed cameras placed on roads, and many people killed in this road accidents, an eight-years period since the introduction of speed sameras. The table presents the result of a survery on people opinions on speed cameras.
Overall, the speed camera fine and road accident fatalities illustrate of fine people and ratio of people in 8 years. The table reprents the result of citien who agree or disagree and some show no reponse.
To begin with, the speed cameras fine show the years 1 to 8. 1 to 5 year show the cameras fine, from 200,000 to around at 600,000 drematic to raise and 5 to 8 show the high level, frome 600,000 to around at 1,600,000.
32% people agree and 60% produce bad result and 8% dont know.
the second table show 8 years and 1 to 8 and road accident in 1 to 3 years around 3300 and 3 to 4 year the accident ratio recline sharply around 3000 and 4 to 6 flacuate and 6 to 8 frome 3000 to around 3300.
AI examiner evaluation
| Criterion | Band |
|---|---|
| Task Achievement / Task Response | 4.5 |
| Coherence and Cohesion | 4.5 |
| Lexical Resource | 4.5 |
| Grammatical Range and Accuracy | 4.5 |
| Overall | 4.5 |
Task Achievement / Task Response: Band 4.5
You identify the two graphs and the survey, and you report some relevant figures, including fines rising from about 200,000 to 1.6 million and the 32%/60%/8% responses on whether cameras reduce accidents. However, the overview is unclear: “illustrate of fine people and ratio of people” does not summarise the main trends. Coverage is also incomplete because the survey results about the purpose of cameras and their number are omitted. Some details are inaccurate or confusing: the fatalities are described as falling sharply to around 3,000, although they fluctuate within a relatively narrow range and finish at about 3,350. Focus on the key overall patterns and include the main findings from all three survey questions.
Coherence and Cohesion: Band 4.5
There is an attempt to organise the report with an introduction, an overview, and phrases such as “To begin with” and “the second table.” This gives the reader some indication of the intended sequence. However, the progression is difficult to follow because the overview is vague and the body shifts between the graphs and survey without a clear plan. For example, “32% people agree…” appears between the discussion of fines and fatalities, while the survey’s other results are not presented. References such as “the second table” are also confusing because the visual includes graphs and survey tables. Use separate paragraphs for the graphs and survey, and connect each paragraph’s details to a clear overview.
Lexical Resource: Band 4.5
The response uses some task-related vocabulary, including “speed cameras,” “road accident,” “fluctuate,” and “ratio,” so the topic is generally recognisable. However, the range is basic and several word choices or collocations make the meaning unclear, such as “produce bad result,” “fine people,” and “illustrate of fine people.” Spelling errors are frequent, including “Britian,” “sameras,” “survery,” “reponse,” and “flacuate,” which also reduce the report’s clarity. Aim for precise chart language and check spelling carefully. For example, describe fines as “the number of fines issued” and fatalities as “the number of people killed,” rather than using “ratio” when no ratio is shown.
Grammatical Range and Accuracy: Band 4.5
You attempt both simple statements and longer sentences, and the opening tries to combine information about the graphs and survey. However, grammatical errors are frequent and sometimes distort meaning. For example, “The line graphs compares” has subject–verb disagreement, while “many people killed in this road accidents” lacks a clear grammatical structure and has an incorrect determiner. Phrases such as “from 200,000 to around at 600,000” and “the second table show 8 years” also show problems with sentence construction, articles, and verb agreement. Use shorter, complete sentences first, checking that each has a clear subject and verb; then add more complex structures only when you can control them accurately.
See this exact question answered at other band scores. The same prompt compared across bands.
Browse more IELTS Writing model answers or get your own writing scored by the same AI examiner.