Band 4.0 IELTS Writing Task 1 Model Answer
Overall Band Score: 4.0 · IELTS Complete Catalyst · 2026-11-18
IELTS Writing Task 1 question
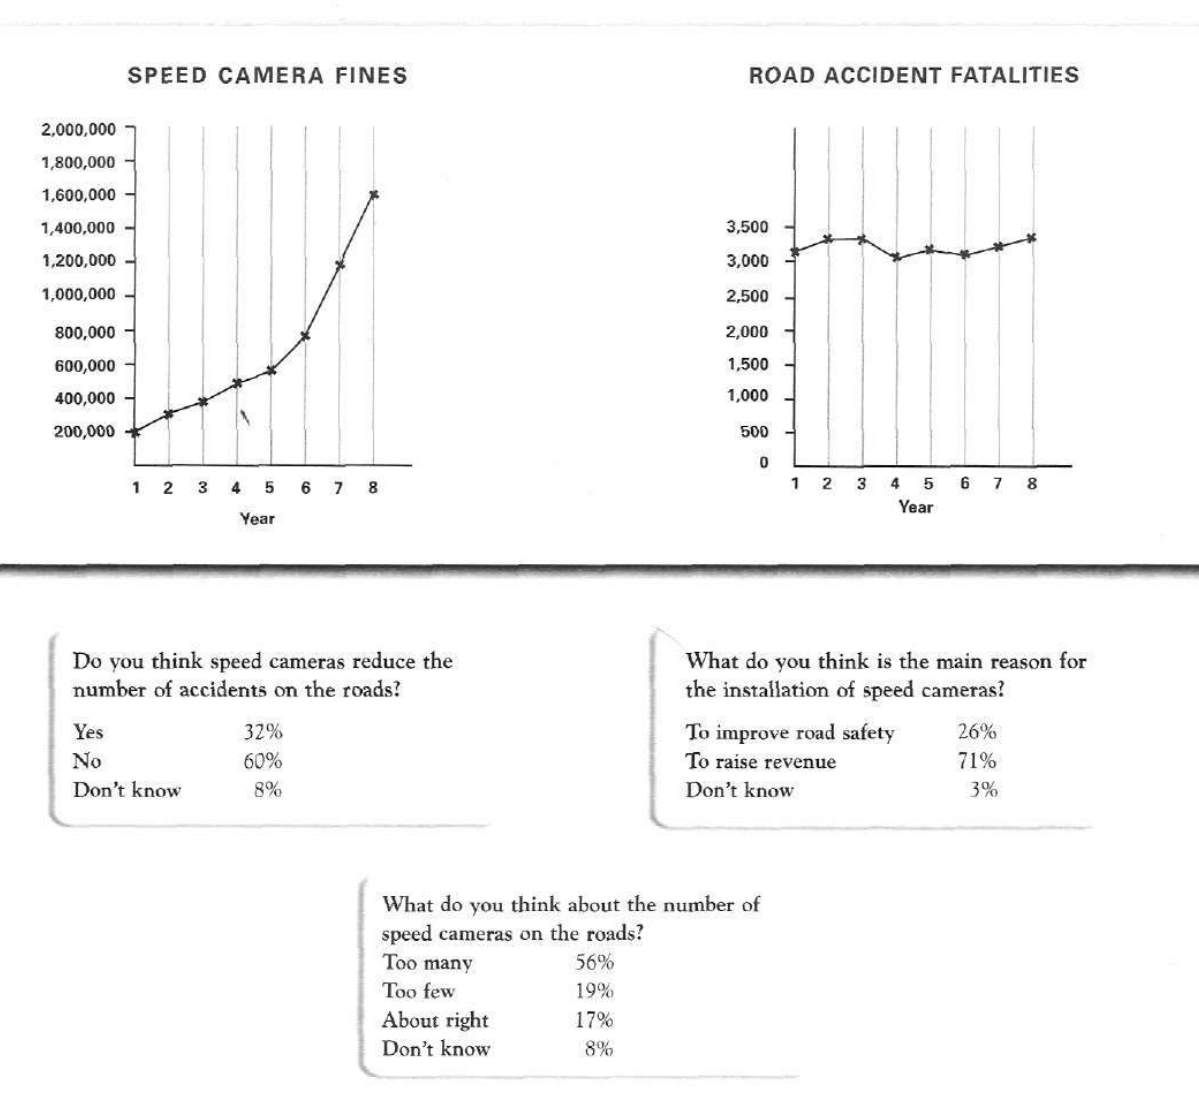
The graphs below show the number of drivers in Britain who have been caught driving too fast by speed cameras placed on roads, and the number of people killed in road accidents, over an eight-year period since the introduction of speed cameras. The tables show the results of a survey on people's opinions on speed cameras.
Write a report for a university lecturer describing the information below.
SPEED CAMERA FINES and ROAD ACCIDENT FATALITIES
Student answer (Band 4.0)
The chart here show the number of drivers in Britian who have been caught driving too fast by speed camers merge on roads .The chart summarize that about 3000 to 3500 road accidents Fatalities occous and the number of peoples killed in road accidents over an eight year span since the introduction of digital cameras .About [redacted phone] to [redacted phone] speed camers fines since when they are introduced .By describing the bar chart or graph we should know about the rules and regulations about the cause of road accidents .We follow the rules according to the traffic signals so, we become save and mitigate the the rate of accidents and save the lives of people .In cotrast we also prevent the fines by over seepding due to digital cameras .In this chart we know about the rules and becomes safe from fines due to overspeeding with the help of digital cameras
AI examiner evaluation
| Criterion | Band |
|---|---|
| Task Achievement / Task Response | 3.0 |
| Coherence and Cohesion | 3.0 |
| Lexical Resource | 4.5 |
| Grammatical Range and Accuracy | 4.5 |
| Overall | 4.0 |
Task Achievement / Task Response: Band 3.0
The response recognises the general subject and mentions both fines and road fatalities, but it does not adequately report the visual information. It gives a broad range for fatalities and fines rather than describing the key trends: fines rose markedly from about 200,000 to 1.6 million, while fatalities fluctuated around 3,100–3,350. The survey results are omitted entirely, and there is no clear overview comparing the charts with the public’s opinions. Much of the response shifts into advice about following traffic rules and avoiding fines, which is not required in this report. The response is also 17 words below the 150-word minimum. To improve, summarise the main patterns and include the most notable survey percentages, without adding personal recommendations.
Coherence and Cohesion: Band 3.0
There is a basic attempt to move from describing the charts to discussing road safety, and a contrast marker appears in “In cotrast.” However, the ideas do not form a clear report: the response has no distinct overview or organised paragraphs, and the final sentences repeat the point about becoming safe and avoiding fines. Connections between statements are often unclear, as in “By describing the bar chart or graph we should know about the rules,” which does not logically explain the data. The repeated use of “chart” and “digital cameras” also makes the progression feel circular. Organise the response into an introduction, an overview, and focused detail paragraphs, using linking phrases to show comparisons and trends.
Lexical Resource: Band 4.5
The response uses some relevant topic vocabulary, including “road accidents,” “fatalities,” “fines,” and “traffic signals,” so the general subject is recognisable. However, the range is limited and several word choices or spellings reduce clarity: “camers,” “Britian,” “occous,” and “seepding” are inaccurate, while “digital cameras” is not the wording used in the task and is repeated. Phrases such as “the chart summarize” and “the number of peoples killed” are also unnatural. Build a more precise range for describing data, such as “rose steadily,” “fluctuated,” and “accounted for,” and check spelling and collocations before submitting.
Grammatical Range and Accuracy: Band 4.5
The response mainly uses simple sentence patterns, with limited evidence of controlled complex structures. Errors in agreement and sentence formation occur in examples such as “The chart here show” and “The chart summarize,” where the singular subject requires a singular verb. The opening sentence is difficult to parse because several ideas are joined without clear grammatical structure, and “since when they are introduced” does not form a correct time clause. There are also problems with articles, plurals, and punctuation, including “the the rate” and inconsistent capitalisation within sentences. Practise writing clear subject–verb sentences first, then add accurate clauses to compare the two trends and report survey findings.
See this exact question answered at other band scores. The same prompt compared across bands.
Browse more IELTS Writing model answers or get your own writing scored by the same AI examiner.