Band 5.0 IELTS Writing Task 1 Model Answer
Overall Band Score: 5.0 · IELTS Complete Catalyst · 2026-11-18
IELTS Writing Task 1 question
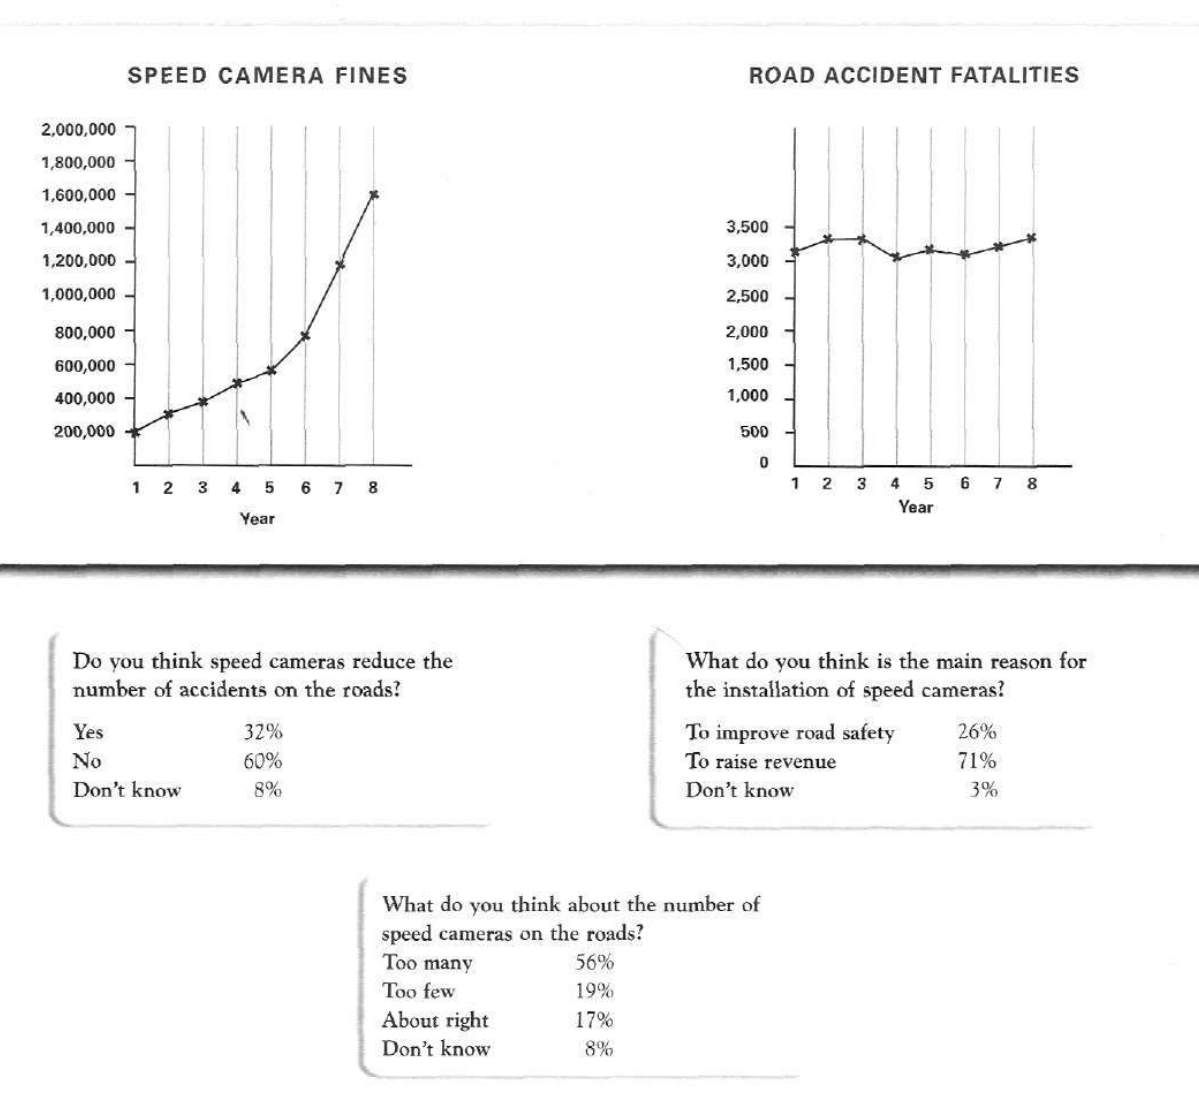
The graphs below show the number of drivers in Britain who have been caught driving too fast by speed cameras placed on roads, and the number of people killed in road accidents, over an eight-year period since the introduction of speed cameras. The tables show the results of a survey on people's opinions on speed cameras.
Write a report for a university lecturer describing the information below.
SPEED CAMERA FINES and ROAD ACCIDENT FATALITIES
Student answer (Band 5.0)
The provided line graphs depict the number of drivers in Britain who have been caught driving too fast by speed cameras placed on roads, and the number of people killed in road accidents, over an eight-year period since the introduction of speed cameras and conducted a survey onn speed cameras.
The fines by speed camera in first year was 200,000 which gradually incresed every year. In 3rd year, it reached at 400,000 and in year 5, it was corssing the number of 600,000 fines but in year, 7 and 8, the number of fines jumped to 1200,000 and 1400,000.
The number of road accident were almost same in whole time period with liffle fluctuation. In first 3 year, it was almost same number of accidents which was mo9re than 3000 but in year 4 and 5, it went down to 3000 and again goes up to 3000.
The survey illustrates the opinion on the installation of speed cameras, 32% people thinks that cameras reduced the number of accidents on road but 60% people are not agreed with this opinion and only 8% were not interested in survey. 26% citizens think that cameras improved the road safety and 71% people were said, it was only for revenue collection and only 3% were into any opinion. The number of speed cameras on roads were too many which was 56% people's opinion
AI examiner evaluation
| Criterion | Band |
|---|---|
| Task Achievement / Task Response | 5.0 |
| Coherence and Cohesion | 5.0 |
| Lexical Resource | 5.0 |
| Grammatical Range and Accuracy | 5.0 |
| Overall | 5.0 |
Task Achievement / Task Response: Band 5.0
You identify the two charts and report several central figures, including the initial 200,000 fines and the survey’s 32%, 60%, 26% and 71% results. However, coverage is partial and some data are inaccurate: fines in years 7 and 8 are given as 1,200,000 and 1,400,000, rather than approximately 1,180,000 and 1,600,000; the year-5 figure is also described as exceeding 600,000, though it is about 580,000. The fatalities trend is unclear and misreported: it fluctuates around 3,100–3,350, rather than following the sequence described. The final survey question is left incomplete, and there is no clear overview highlighting the sharp rise in fines alongside broadly stable fatalities. Add an overview and cover all three survey questions accurately.
Coherence and Cohesion: Band 5.0
The response has a basic paragraph structure: it introduces the visuals, discusses the two line graphs, and then turns to the survey. This gives the reader some sense of organisation. However, progression within paragraphs is weak, and the report ends abruptly after stating that 56% thought there were too many cameras. The remaining responses—19% saying too few, 17% about right and 8% unsure—are omitted. Linking is also limited and sometimes awkward, as in “but in year, 7 and 8,” while repeated use of “and” makes relationships between details less clear. A concise overview paragraph followed by clearly separated chart and survey summaries, with accurate comparisons and transitions, would make the information easier to follow.
Lexical Resource: Band 5.0
You use some relevant task vocabulary, such as “fluctuation,” “revenue collection” and “road safety,” and the reader can generally understand the topic. However, the range is limited and several noticeable spelling and word-choice errors reduce clarity: “incresed,” “corssing,” “liffle” and “mo9re” appear in the graph description. Some expressions are also imprecise or unnatural, including “fines by speed camera” and “were not interested in survey”; the latter does not accurately convey that respondents did not know. Use standard trend language and precise survey terms, such as “the number of fines,” “remained broadly stable” and “were unsure.” Proofreading spelling and choosing natural collocations would make the report more precise and easier to read.
Grammatical Range and Accuracy: Band 5.0
The response communicates basic information using simple sentences and some attempts to combine ideas, but the range of structures is limited and errors occur frequently. For example, “The fines by speed camera in first year was 200,000” has problems with articles, number agreement and sentence structure; “The number of road accident were” also has incorrect agreement and plural marking. Verb forms are inconsistent in “it went down … and again goes up,” and the survey sentence “71% people were said” is not grammatically formed. These errors sometimes make relationships or meanings difficult to follow. Practise accurate past-tense reporting, subject–verb agreement and complete sentence patterns, then check articles and plurals. More controlled complex sentences would help you describe comparisons without sacrificing accuracy.
See this exact question answered at other band scores. The same prompt compared across bands.
Browse more IELTS Writing model answers or get your own writing scored by the same AI examiner.