Band 4.5 IELTS Writing Task 1 Model Answer
Overall Band Score: 4.5 · IELTS Complete Catalyst · 2026-11-18
IELTS Writing Task 1 question
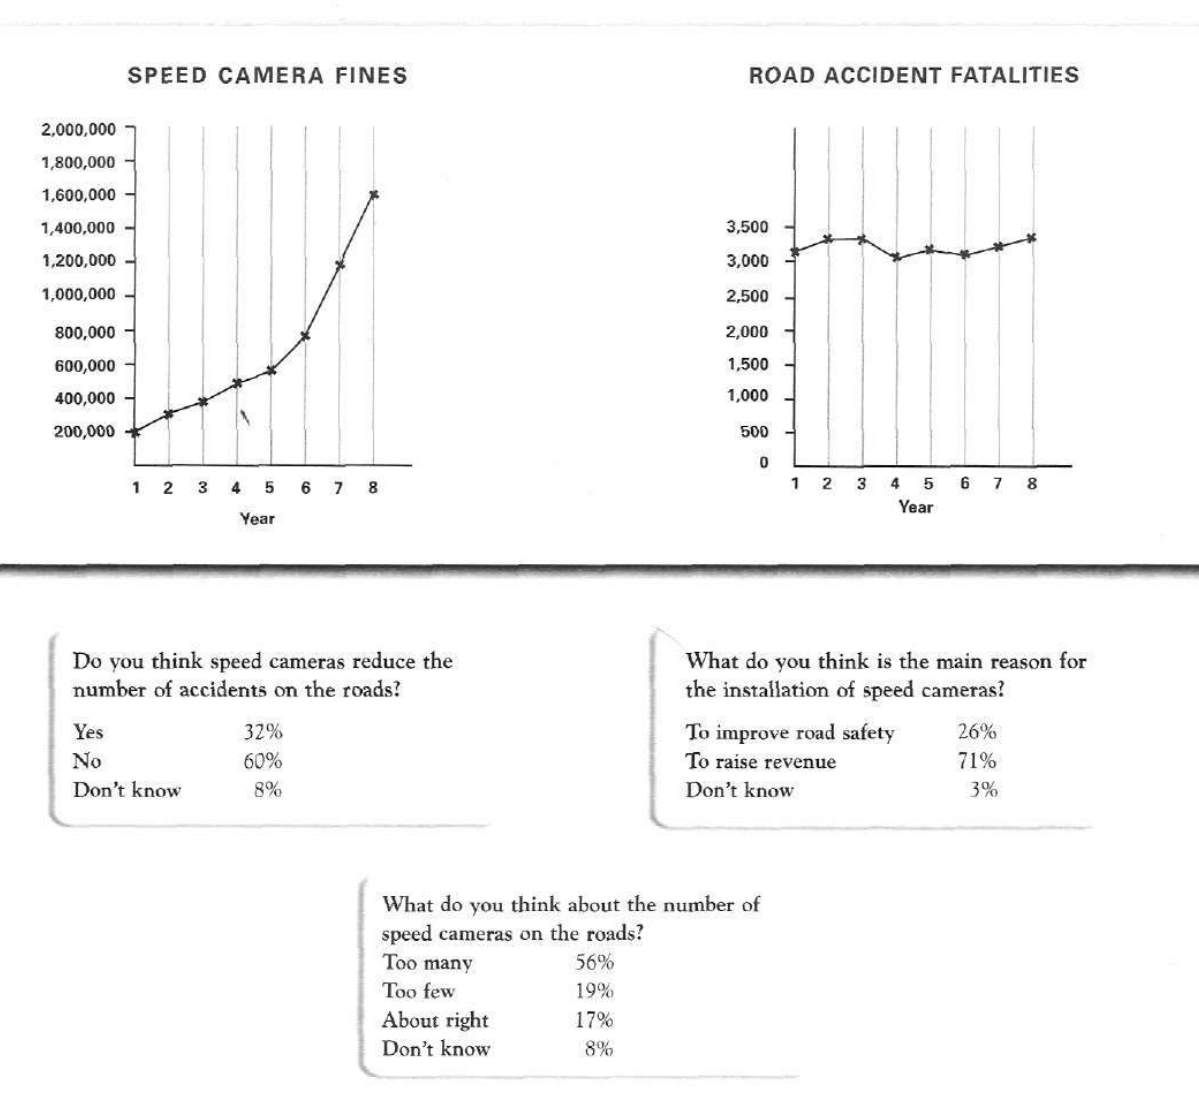
The graphs below show the number of drivers in Britain who have been caught driving too fast by speed cameras placed on roads, and the number of people killed in road accidents, over an eight-year period since the introduction of speed cameras. The tables show the results of a survey on people's opinions on speed cameras.
Write a report for a university lecturer describing the information below.
SPEED CAMERA FINES and ROAD ACCIDENT FATALITIES
Student answer (Band 4.5)
the line graph illustrate that , the number of drivers in Britain have been caought because of , driving insainly by speed camera placed on roads , and the number of people killed in road accidents , from eight years since introduction of speed cameras . the line graph provide the outcomes of a survey on peoples point of view on speed cameras. initially speed camera fines steadly rose in the enier year . Moreover, road accident fatalities has some fluctuations . speed camera fines increases brick by brick , in the 1st year 200,000 to 600,000 in 5th year then dramatically up 1,600,000 in 8th year . road accident fatalities 1st year 3,000 then in secound and third year 3,500 afterwerd , it decline into same state however , in the 8th year remaining same . some individualls think that the number of accidents on the road reduce 32% , some people think that it not reduce . the majority of individuals think the main reason for the installation of speed camera to improve road safety 26% ,some think to raise revenue 71% . the number of speed cameras on the road too many such as 56% , some think that too few 19% .
AI examiner evaluation
| Criterion | Band |
|---|---|
| Task Achievement / Task Response | 5.0 |
| Coherence and Cohesion | 4.0 |
| Lexical Resource | 4.5 |
| Grammatical Range and Accuracy | 4.5 |
| Overall | 4.5 |
Task Achievement / Task Response: Band 5.0
You identify the two chart topics and include several survey results, so the report is relevant to the task. However, coverage is partial and some key details are inaccurate or unclear. Fines rose from 200,000 to about 580,000 by year five, not 600,000 exactly, before reaching 1.6 million; the overall increase is noted, but the intermediate pattern is only briefly described. Fatalities fluctuated around 3,100–3,350, rather than falling and then “remaining same” in the final year. The survey figures are mostly reported, but the claim that most people thought cameras were installed to improve safety reverses the result: 71% chose raising revenue, compared with 26% for safety. Give a clearer overview and check comparisons against the data.
Coherence and Cohesion: Band 4.0
There is a basic attempt to organise the report: an opening identifies the visuals, followed by a brief overview and then details about the charts and survey. However, progression is difficult to follow because the information is compressed into long, loosely connected sections, with little separation between chart data and survey findings. Connectors such as “Moreover,” “afterwerd,” and “however” do not always show the relationship accurately, and the final survey results are crowded together. Use distinct paragraphs for the overview, numerical trends, and survey, and group related comparisons in a logical order. Clearer sentence boundaries and more precise linking would make the report easier to follow.
Lexical Resource: Band 4.5
You use some task-related vocabulary, including “fluctuations,” “fatalities,” “installation,” and “revenue,” which helps communicate the subject. However, the range is limited and several choices or spellings make the meaning less clear or sound unnatural. “Driving insainly” does not accurately express being caught speeding; “speeding” or “exceeding the speed limit” is appropriate. “Increases brick by brick” is an unsuitable collocation for a chart trend, while “rose steadily” would be clearer. There are also frequent spelling errors, such as “caought,” “steadly,” and “individualls.” Aim for accurate, conventional trend language and check spelling carefully; this will improve precision without requiring more elaborate vocabulary.
Grammatical Range and Accuracy: Band 4.5
The response attempts both simple and longer sentences, but control is inconsistent, and errors often make relationships between ideas difficult to understand. For example, “the number of drivers in Britain have been” has subject–verb disagreement, while “road accident fatalities has some fluctuations” also uses an incorrect verb form. Tense and sentence construction are unstable in “speed camera fines increases … then dramatically up,” and several clauses are joined without clear punctuation. Articles and plural forms are also frequently missing or inconsistent. Practise building accurate sentences with a clear subject and verb, then use past-tense forms consistently to describe the eight-year period. Shorter, correctly punctuated sentences would help convey the data more reliably.
See this exact question answered at other band scores. The same prompt compared across bands.
Browse more IELTS Writing model answers or get your own writing scored by the same AI examiner.