Band 7.0 IELTS Writing Task 1 Model Answer
Overall Band Score: 7.0 · IELTS Complete Catalyst · 2026-11-19
IELTS Writing Task 1 question
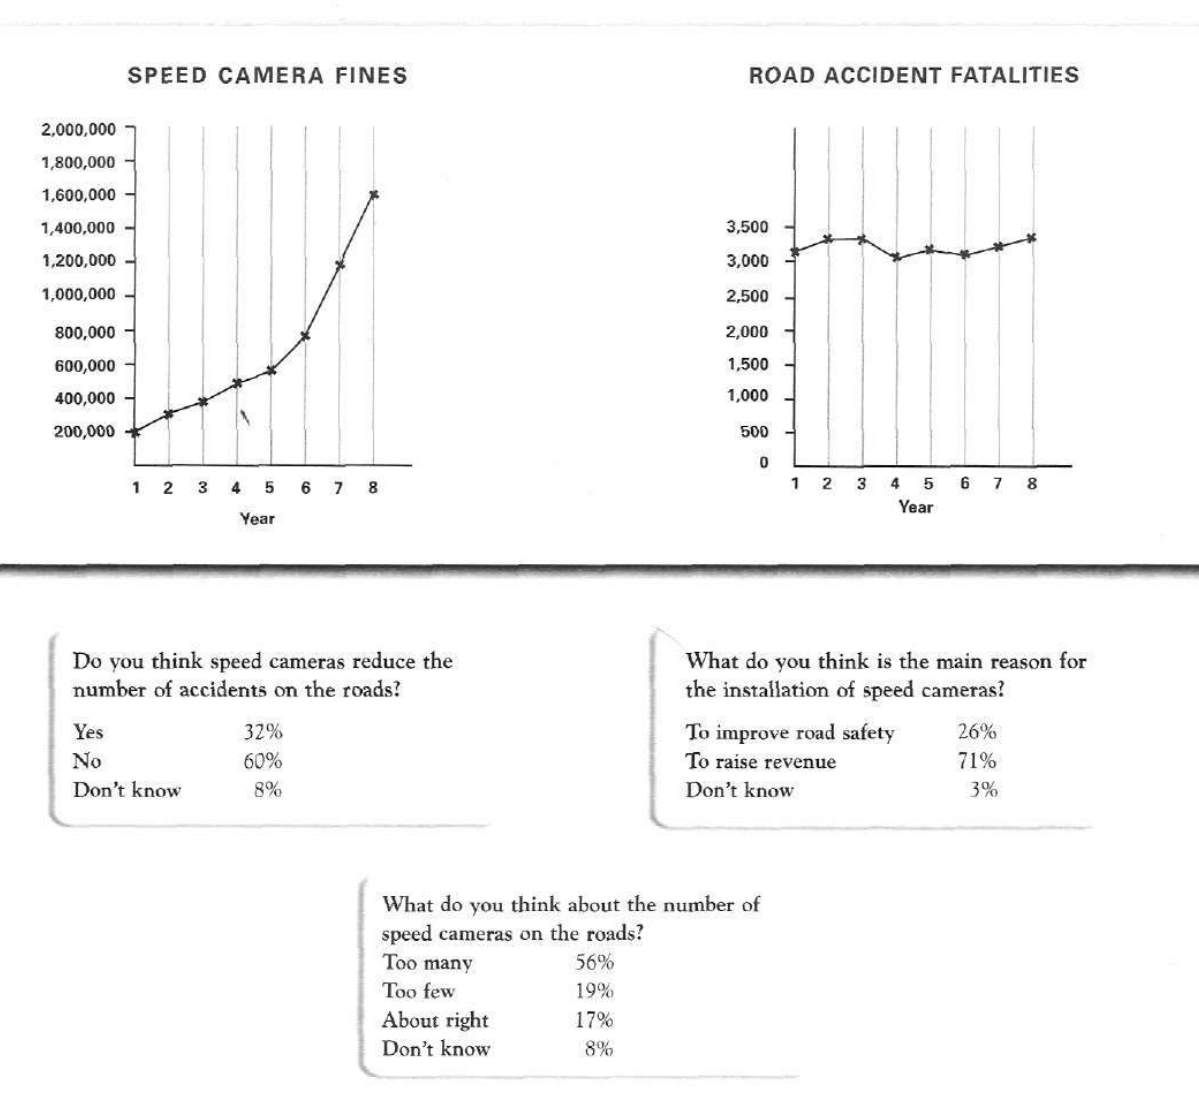
The graphs below show the number of drivers in Britain who have been caught driving too fast by speed cameras placed on roads, and the number of people killed in road accidents, over an eight-year period since the introduction of speed cameras. The tables show the results of a survey on people's opinions on speed cameras.
Write a report for a university lecturer describing the information below.
SPEED CAMERA FINES and ROAD ACCIDENT FATALITIES
Student answer (Band 7.0)
The graphs illustrate the number of drivers fined for speeding by camera and the number of road accident fatalities in Britain over an eight-year period. The tables present public opinions regarding speed cameras.
Overall, the numbers of speeding fines increased significantly, whereas road accident fatalities remained reletively stable throughout the period.
In the first year, approximately 200,000 drivers were fined for speeding . This figure rose steadily to around 550,000 in the fifth year, before increasingly sharply to 1.6 million by the eighth year.
By contrast road accident fatalities fluctuated slightly, starting at approximately 3,100 in the first year. the figure peaked at around 3,300 in the second and third years, before falling to 3,000 in the fourth year. It then remained relatively unchanged, ending at approximately 3,300.
Regarding public opinions, 60% of respondents believed that speed cameras did not reduce accidents, while 32% disagreed and 8% says that they did'nt know. 26% people believed that reason of installing speed cameras is to improve road safety and 71% would think that to raise revenue and 3% dont know.
56% think there is too many cameras 19% believed that too few and 17% about right , 8% don't know.
AI examiner evaluation
| Criterion | Band |
|---|---|
| Task Achievement / Task Response | 7.5 |
| Coherence and Cohesion | 7.0 |
| Lexical Resource | 6.5 |
| Grammatical Range and Accuracy | 6.0 |
| Overall | 7.0 |
Task Achievement / Task Response: Band 7.5
The report covers both charts and all three survey questions, and its overview identifies the main contrast accurately: fines rose substantially while fatalities stayed broadly stable. The key figures are generally well selected, including the rise from about 200,000 to 1.6 million and the 60% who said cameras did not reduce accidents. This gives the response a clear, relevant account of the data. Some details are slightly imprecise: fines were about 580,000 in year five rather than 550,000, and fatalities fell to roughly 3,100 in year four, not 3,000. The survey findings are reported but mostly listed rather than compared or interpreted. More precise figures and a little more synthesis of the survey results would strengthen an already effective response.
Coherence and Cohesion: Band 7.0
The information is arranged in a clear sequence: introduction and overview, followed by the two graph trends and then the survey results. Paragraphing helps distinguish these sections, and transitions such as “Overall,” “By contrast,” and “Regarding public opinions” make the progression easy to follow. The contrast between fines and fatalities is especially clear. However, the final paragraph becomes a run of figures with limited linking or grouping, and the last two survey topics are crowded together. Some sentence openings and references could be made more consistent—for example, “the figure” after a full stop should begin with a capital letter. Grouping each survey question into a more clearly connected sentence would make cohesion more flexible and less list-like.
Lexical Resource: Band 6.5
The response uses an adequate range of task-appropriate vocabulary, including “fluctuated slightly,” “remained relatively stable,” “peaked,” and “respondents.” These choices help describe trends and survey results clearly, and the meaning is generally easy to understand. There are also some inaccurate or awkward choices that limit precision: “before increasingly sharply” does not express the intended rapid rise naturally, while “the reason of installing” and “would think that to raise revenue” are not idiomatic. Spelling slips such as “reletively” and “dont” also reduce accuracy. Aim for precise trend language and natural collocations, and proofread spelling; for example, use “rose sharply” and “the main reason for installing cameras.”
Grammatical Range and Accuracy: Band 6.0
There is a useful mix of simple and more complex sentence forms, including the contrast structure “whereas road accident fatalities remained…” and the time sequence “before … by the eighth year.” Most of the data descriptions remain understandable. However, some grammatical errors recur, particularly in the survey section: “26% people believed” needs a determiner or a different construction, and “56% think there is too many cameras” has a subject–verb agreement problem. The sentence beginning “the figure peaked” also needs a capital letter, and “8% says” does not agree with the plural subject “8%” understood as respondents. More consistent control of agreement, articles, and sentence boundaries would improve accuracy while retaining the range already attempted.
See this exact question answered at other band scores. The same prompt compared across bands.
Browse more IELTS Writing model answers or get your own writing scored by the same AI examiner.