Band 5.5 IELTS Writing Task 1 Model Answer
Overall Band Score: 5.5 · IELTS Complete Catalyst · 2026-11-19
IELTS Writing Task 1 question
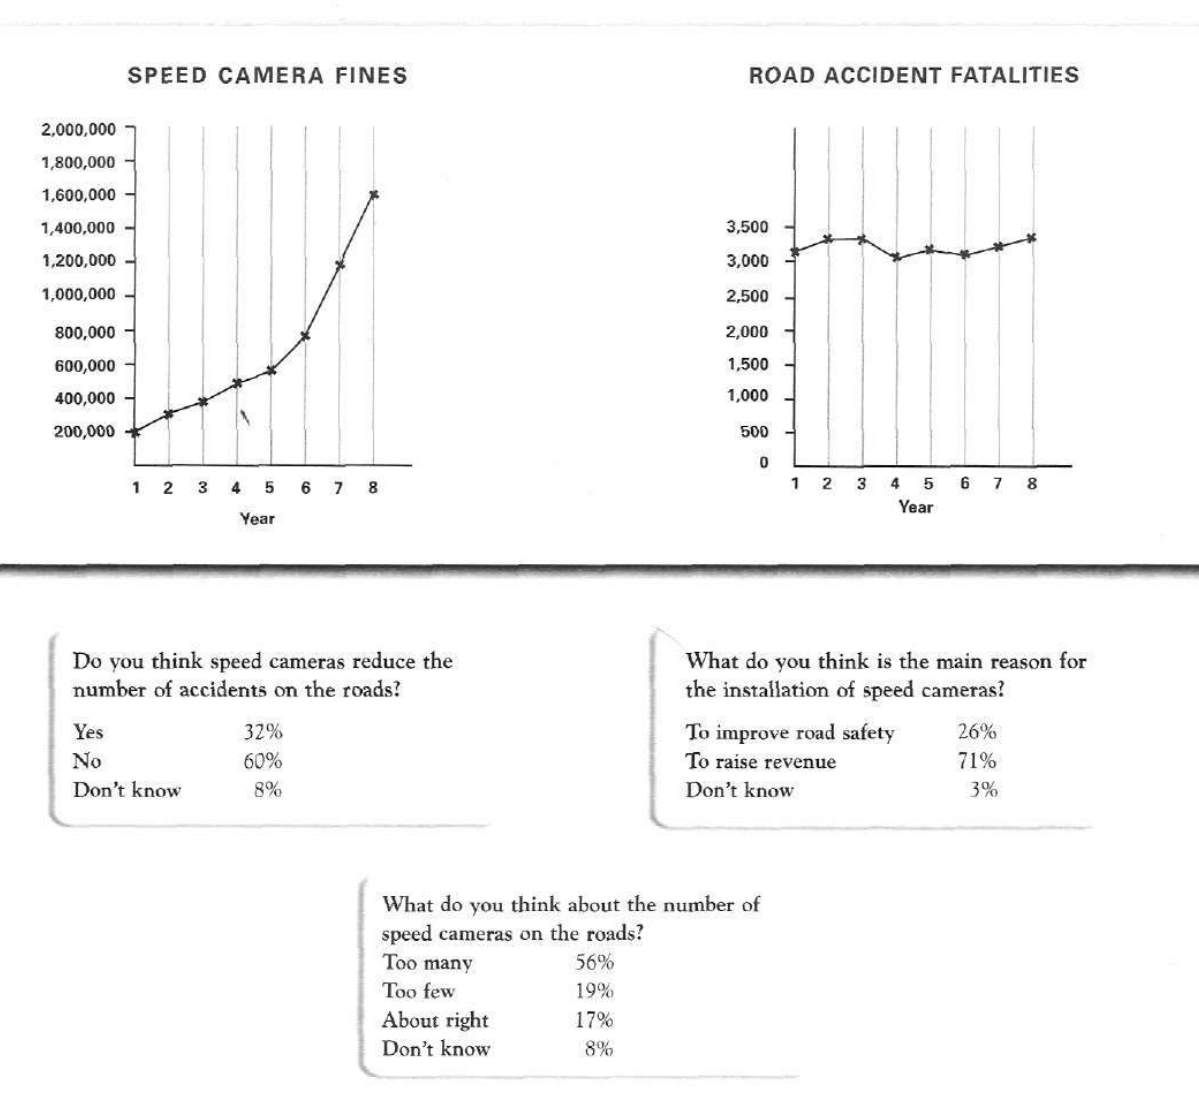
The graphs below show the number of drivers in Britain who have been caught driving too fast by speed cameras placed on roads, and the number of people killed in road accidents, over an eight-year period since the introduction of speed cameras. The tables show the results of a survey on people's opinions on speed cameras.
Write a report for a university lecturer describing the information below.
SPEED CAMERA FINES and ROAD ACCIDENT FATALITIES
Student answer (Band 5.5)
The graph illustrates the number of fast drivers caught by Britain with the help of speed cameras placed on roads ,and the amount of people killed in road accidents,over a period of 8 years .The tables shows the result of a survey on people's suggestions on speed cameras.
overall,fines on overspeed rose to higher value ,wheareas road accidents have some fluctuations over the period.however people opinions over accidents and installation of cameras shows different propotion.instllation of cameras was the most highest survey on people opinion .
speed cameras fine rose steadily from 200,000 to600,000 by the mid of the year .By other half it peacked up by 1600,000 which was the highest fine .on the other hand road accidents fatalities it remained stable and some times fluctuated with the amount of 3000.
Moreover,th table shows opinion of people how cameras reduced te number of accidents and it shows highest value 60% with no accidents .some said 32% and 8%.. to improve safety 26% agreed .revenue increased by 71 % .last table shows indiviual opinnion in which number of cameras on road with 56% and 19% with many and few camers .about right and dont knw its 17%and 8% only.
AI examiner evaluation
| Criterion | Band |
|---|---|
| Task Achievement / Task Response | 5.5 |
| Coherence and Cohesion | 5.5 |
| Lexical Resource | 5.0 |
| Grammatical Range and Accuracy | 5.0 |
| Overall | 5.5 |
Task Achievement / Task Response: Band 5.5
You cover both charts and all three survey questions, and you identify the main contrast: fines rose substantially while fatalities fluctuated. However, several key details are unclear or inaccurate. The fines increased from 200,000 to 1,600,000, but the description “by the mid of the year” and “by other half” does not clearly identify the years or the sharp acceleration in the final years. Fatalities did not simply fluctuate around 3,000; they stayed roughly between 3,100 and 3,350. The survey figures are mostly included, but “60% with no accidents” misrepresents the response as “No” to whether cameras reduce accidents. The overview also makes an unclear claim about installation being the “most highest survey.” Select the main trends and report them precisely.
Coherence and Cohesion: Band 5.5
The response has a basic overall structure: an introduction, an overview, discussion of the charts, and a final paragraph on survey results. This gives the reader some sense of how the information is organised. However, progression within paragraphs is often difficult to follow, and the links between ideas are sometimes mechanical or unclear. For example, “By other half” does not clearly connect to a specific period, while “Moreover” introduces survey details without a clear transition from the chart discussion. The final paragraph moves rapidly through three survey questions, making comparisons hard to track. Use separate, clearly focused paragraphs for the two charts and the survey, and group related figures together. More precise referencing and simpler transitions would make the report easier to follow.
Lexical Resource: Band 5.0
You use some relevant task vocabulary, including “road accidents,” “fatalities,” “fluctuations,” “revenue,” and “road safety,” so the topic is generally recognisable. However, the range is limited and several word choices or collocations make the meaning difficult to understand. “People’s suggestions” is not an accurate description of survey opinions, and “highest value 60% with no accidents” confuses a survey response with an accident figure. There are also noticeable spelling errors, such as “wheareas,” “peacked,” “indiviual,” and “opinnion,” alongside repeated use of basic terms such as “amount” and “shows.” Choose precise reporting language and check spelling carefully; this will help you communicate the data more reliably.
Grammatical Range and Accuracy: Band 5.0
The response attempts both simple and more extended sentences, for example, “The graph illustrates…” and “Moreover, the table shows opinion of people how cameras reduced the number of accidents.” However, grammatical control is inconsistent, and errors frequently make relationships between ideas unclear. There are problems with articles and agreement in “The tables shows,” tense and sentence construction in “how cameras reduced,” and sentence boundaries in the long final paragraph. Commas are often missing or placed with spaces before them, and the overview begins with a lowercase letter. Practise building accurate sentences with a clear subject and verb, and use full stops to separate the survey findings. A wider range of structures will be more effective once these basic patterns are controlled.
See this exact question answered at other band scores. The same prompt compared across bands.
Browse more IELTS Writing model answers or get your own writing scored by the same AI examiner.