Band 5.5 IELTS Writing Task 1 Model Answer
Overall Band Score: 5.5 · IELTS Complete Catalyst · 2026-11-19
IELTS Writing Task 1 question
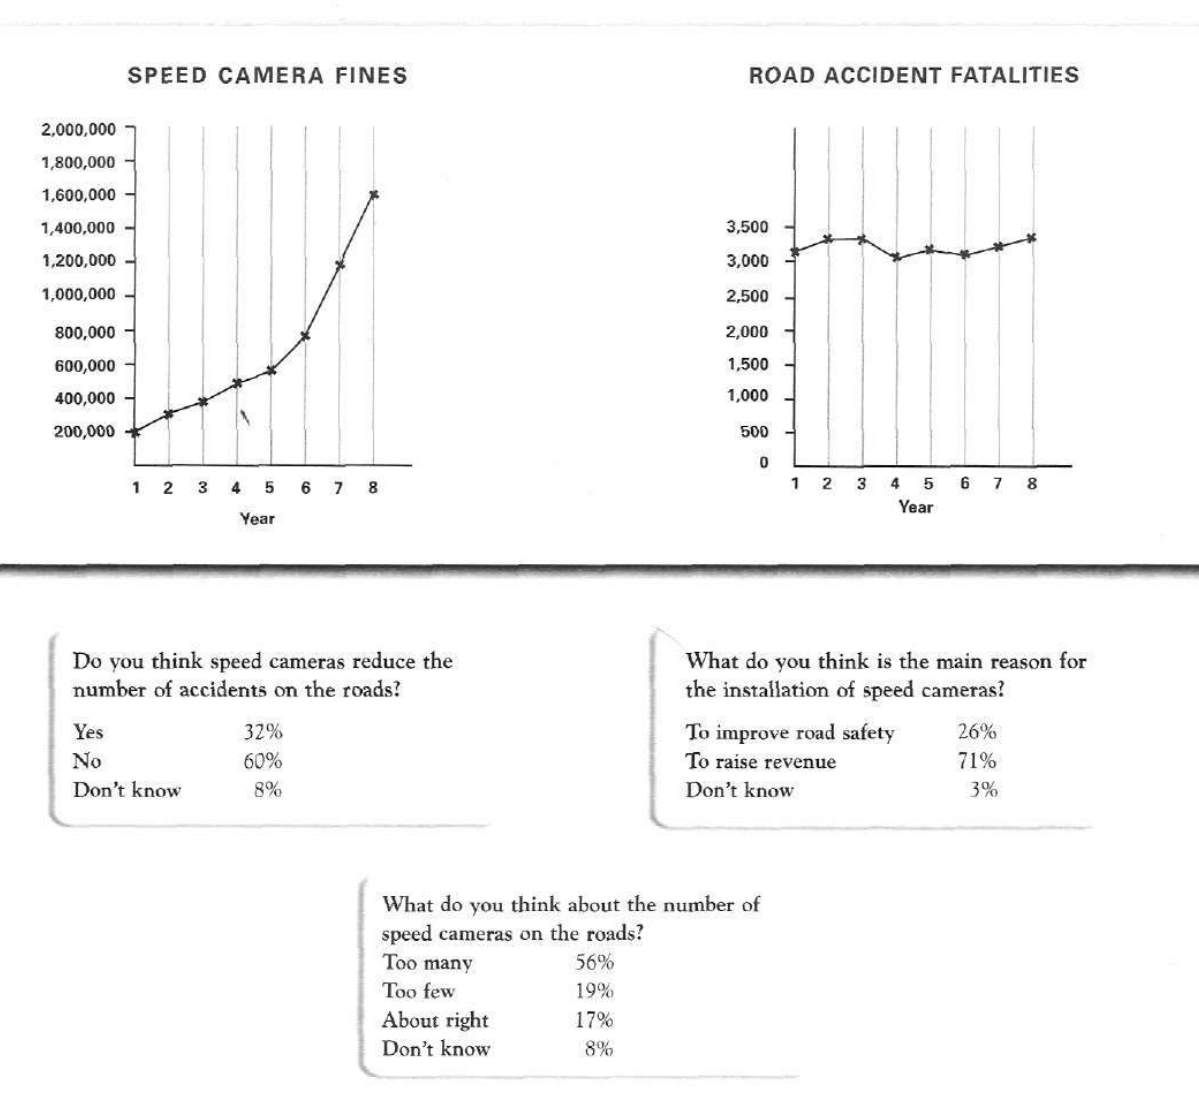
The graphs below show the number of drivers in Britain who have been caught driving too fast by speed cameras placed on roads, and the number of people killed in road accidents, over an eight-year period since the introduction of speed cameras. The tables show the results of a survey on people's opinions on speed cameras.
Write a report for a university lecturer describing the information below.
SPEED CAMERA FINES and ROAD ACCIDENT FATALITIES
Student answer (Band 5.5)
The line graph demonstrates the number of drivers in United kingdom and caught by speed cameras while over speeding. The graph also illustrates the number of people killed in road accidents,since the introduction of speed cameras above 8 years of period. The table depict the conseqveruences of research on individuals opinions on speed cameras.
Overall the people who fined are 1600k while the people who killed are about 3300.
initially the fine ratio by speed cameras are 200K and gradually increased upto 800k in the early years while a sudden change can be seen in the last two years which is twice of the early 6 years. Furthermore the road accident fatalities fluctuates year to year. In first two years the ratio slighty increased while in 3rd year reduction can be seen and again a little bit increased occur in the forth year moreover it increased slowly until the end.
It is clear from the survey that speed cameras did not reduce the accidents but in contrast the reason for installation was to generate a revenue moreover the survey also suggest that the number of cameras installed on the road are too many.
AI examiner evaluation
| Criterion | Band |
|---|---|
| Task Achievement / Task Response | 5.5 |
| Coherence and Cohesion | 5.5 |
| Lexical Resource | 5.0 |
| Grammatical Range and Accuracy | 5.0 |
| Overall | 5.5 |
Task Achievement / Task Response: Band 5.5
You identify the main topics and include a broad overview: fines rise substantially, fatalities fluctuate, and respondents are generally sceptical about cameras. However, the overview is imprecise: “the people who fined are 1600k” gives only the final fines figure and does not clearly compare the overall trends. Some details are inaccurate or unclear. Fines reach about 1.6 million in year 8, but the rise is not simply a sudden change in the last two years; it accelerates from year 6 onward. Fatalities do not follow the sequence described: they rise in years 2–3, fall in year 4, then fluctuate and finish at their highest level. The survey is summarised, but its key percentages are omitted. Select and report the main figures more accurately, including the 60% who said cameras do not reduce accidents and the 71% who thought revenue was the main reason.
Coherence and Cohesion: Band 5.5
The response has a recognisable structure, moving from an introduction and overview to graph details and then survey findings. This gives the reader some organisation. However, progression within the body is not consistently clear: the account of fatalities uses a confusing sequence (“in 3rd year reduction can be seen and again a little bit increased occur in the forth year”), which makes the trend difficult to follow. Linking words such as “Furthermore,” “moreover” and “in contrast” are used, but sometimes mechanically or without a clear relationship between the ideas. The final paragraph combines several survey conclusions in one long sentence. Use separate, logically ordered paragraphs for the two graphs and the survey, and connect each comparison explicitly to the relevant data.
Lexical Resource: Band 5.0
You attempt relevant task vocabulary, including “speed cameras,” “road accident fatalities,” “fluctuates” and “installation,” and the reader can generally identify the subject. However, the range is limited and several word choices or collocations are inaccurate, sometimes obscuring meaning. For example, “the people who fined” is not a natural way to describe drivers caught speeding, and “fine ratio” does not accurately name the number of fines. “Consequences of research” is also unsuitable for survey results, while “generate a revenue” is an awkward expression. Spelling errors such as “conseqveruences” and “slighty” further reduce precision. Build a reliable set of chart-reporting terms and check spelling and collocations before submitting.
Grammatical Range and Accuracy: Band 5.0
There are attempts to use complex sentences and sequencing, but the range is limited and errors occur frequently enough to make some sentences difficult to interpret. For instance, “The line graph demonstrates the number of drivers in United kingdom and caught by speed cameras” has an incomplete and awkwardly structured clause. Subject–verb agreement is inconsistent in “The table depict” and “the survey also suggest,” and articles and prepositions are often missing or incorrect. The long sentence beginning “initially the fine ratio…” also contains faulty verb forms and punctuation, while “increased occur” is not grammatically formed. Practise accurate simple sentences first, then add subordinate clauses; check agreement, articles, verb forms and sentence boundaries during editing.
See this exact question answered at other band scores. The same prompt compared across bands.
Browse more IELTS Writing model answers or get your own writing scored by the same AI examiner.