Band 4.0 IELTS Writing Task 1 Model Answer
Overall Band Score: 4.0 · IELTS Complete Catalyst · 2026-11-22
IELTS Writing Task 1 question
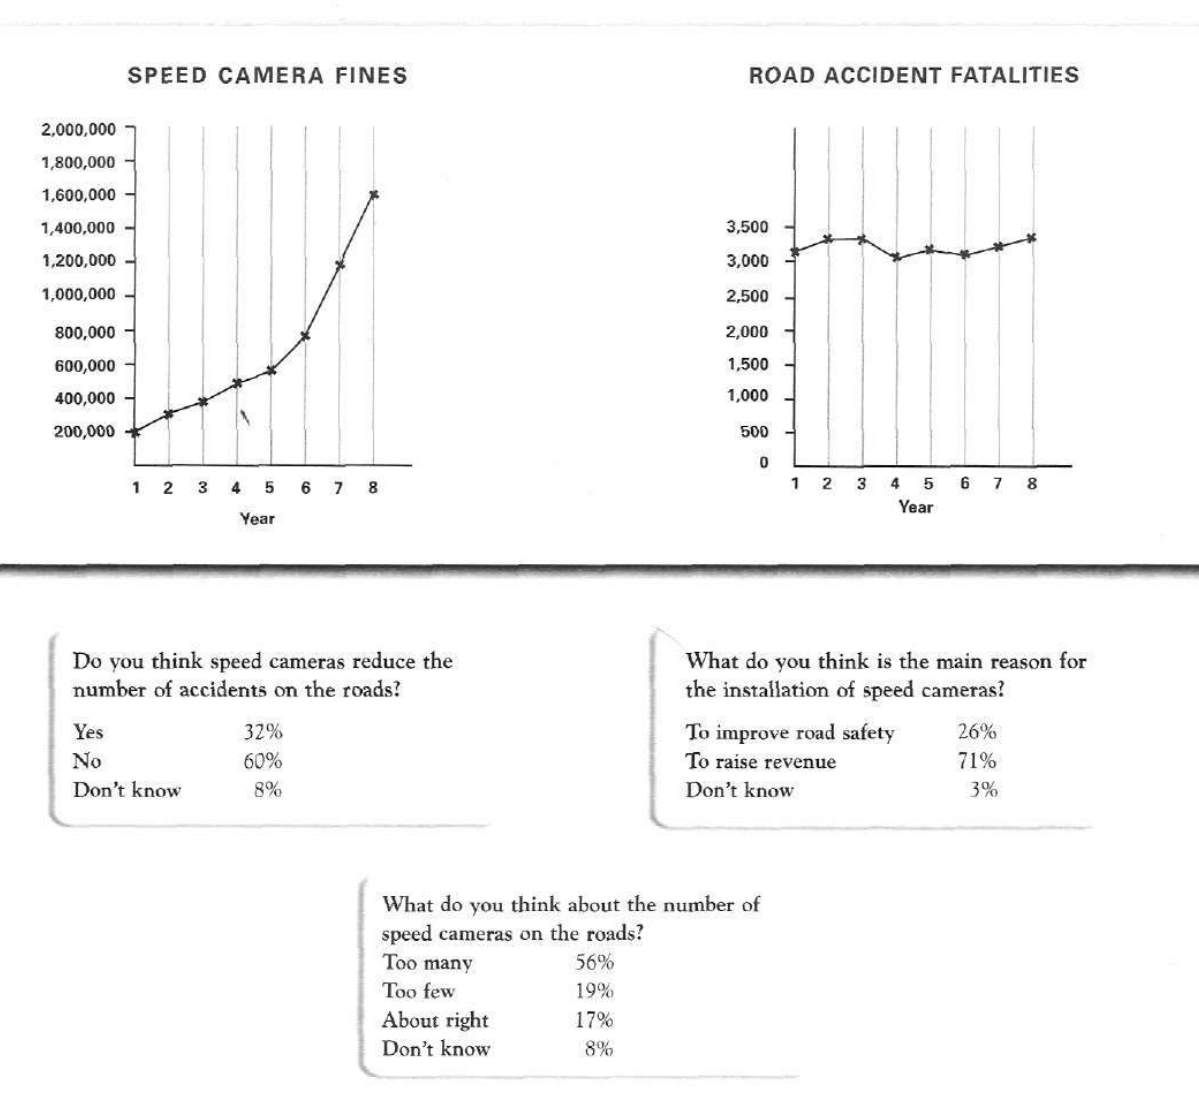
The graphs below show the number of drivers in Britain who have been caught driving too fast by speed cameras placed on roads, and the number of people killed in road accidents, over an eight-year period since the introduction of speed cameras. The tables show the results of a survey on people's opinions on speed cameras.
Write a report for a university lecturer describing the information below.
SPEED CAMERA FINES and ROAD ACCIDENT FATALITIES
Student answer (Band 4.0)
The graphs below illustrates the number of drivers in Britain who have been caught driving too fast by speed cameras placed on roads, and the number of people killed in road accidents, over an eight year a period of time since the introduction of a speed camers . The tables shows the result of a survey on individuals opinions on speed of cameras. The essay discuss about graphs there are two types of a graphs in showing the table .
Firstly, I would like to describe the speed of camera fines . To explanation it, many individuals thought reduce the speed of camera 32% people say yes reduce road accidents 60% people say no and 8% people say don'tknow. For instance, Camera fines are reflected people eyes. However, every people thought to reduce camera speed.
Secondly, the road accidents fatalties in this graph to improve road safety 26% people
to rise revenue 71% and 3% don't know. In other words, all people say that gives them safety roads and reduce road accidents. For example, In this days, too high accidents in the public. hence, the driver also not understand.
overall, both graphs talked to accidents and said reduce speed of cameras and road accidents.
AI examiner evaluation
| Criterion | Band |
|---|---|
| Task Achievement / Task Response | 3.5 |
| Coherence and Cohesion | 4.0 |
| Lexical Resource | 4.5 |
| Grammatical Range and Accuracy | 4.5 |
| Overall | 4.0 |
Task Achievement / Task Response: Band 3.5
The response makes a limited attempt to describe the visuals, but it often confuses what the figures represent. The 32%, 60% and 8% figures are correctly associated with opinions about whether cameras reduce accidents, and the 26%, 71% and 3% figures are given for the perceived reason for installing them. However, these are survey results, not trends in camera fines or fatalities, and the report does not describe either line graph. It also omits the third survey question about the number of cameras. The statement that “all people” believe cameras improve safety contradicts the survey, where most respondents thought revenue was the main reason. Include a clear overview and accurately select key trends and comparisons from all the visuals.
Coherence and Cohesion: Band 4.0
There is a basic attempt to organise the report, with an opening, paragraphs beginning “Firstly” and “Secondly,” and a brief conclusion. These markers show an effort to guide the reader. However, the paragraphs do not follow a clear sequence through the visuals: the first discusses one survey question, while the second labels another survey question as road fatalities. The final sentence, “both graphs talked to accidents,” does not summarise the information clearly, and links such as “For instance” and “In other words” introduce ideas that do not support the figures. Group the line graphs together and the survey results together, then use accurate references and simple transitions to show how each point relates to the data.
Lexical Resource: Band 4.5
The response uses some task-related vocabulary, including “speed camera fines,” “road accidents,” “road safety” and “revenue,” so the topic is generally recognisable. However, word choice and collocation are often inaccurate or repetitive, which makes several points difficult to interpret. Phrases such as “reduce the speed of camera,” “Camera fines are reflected people eyes” and “the driver also not understand” do not express clear meanings in this context. There are also spelling and word-form problems, including “camers,” “fatalties” and “don'tknow.” Build a more precise range for describing data, such as “rose,” “remained relatively stable,” “respondents” and “accounted for,” and check spelling before submitting.
Grammatical Range and Accuracy: Band 4.5
The writing shows an attempt to use both simple statements and longer clauses, but control of sentence structure is inconsistent. Errors in agreement and articles appear in the opening: “The graphs below illustrates” and “The tables shows.” Other examples include “over an eight year a period of time” and “In this days, too high accidents,” where sentence construction and grammatical patterns are faulty. Some sentences are fragments or lack a clear relationship between clauses, as in “Secondly, the road accidents fatalties in this graph to improve road safety 26% people.” Use short, complete sentences to report each figure, checking subject–verb agreement, articles and plural forms; then add more complex structures only when their meaning is clear.
See this exact question answered at other band scores. The same prompt compared across bands.
Browse more IELTS Writing model answers or get your own writing scored by the same AI examiner.