Band 6.0 IELTS Writing Task 1 Model Answer
Overall Band Score: 6.0 · IELTS Complete Catalyst · 2026-11-22
IELTS Writing Task 1 question
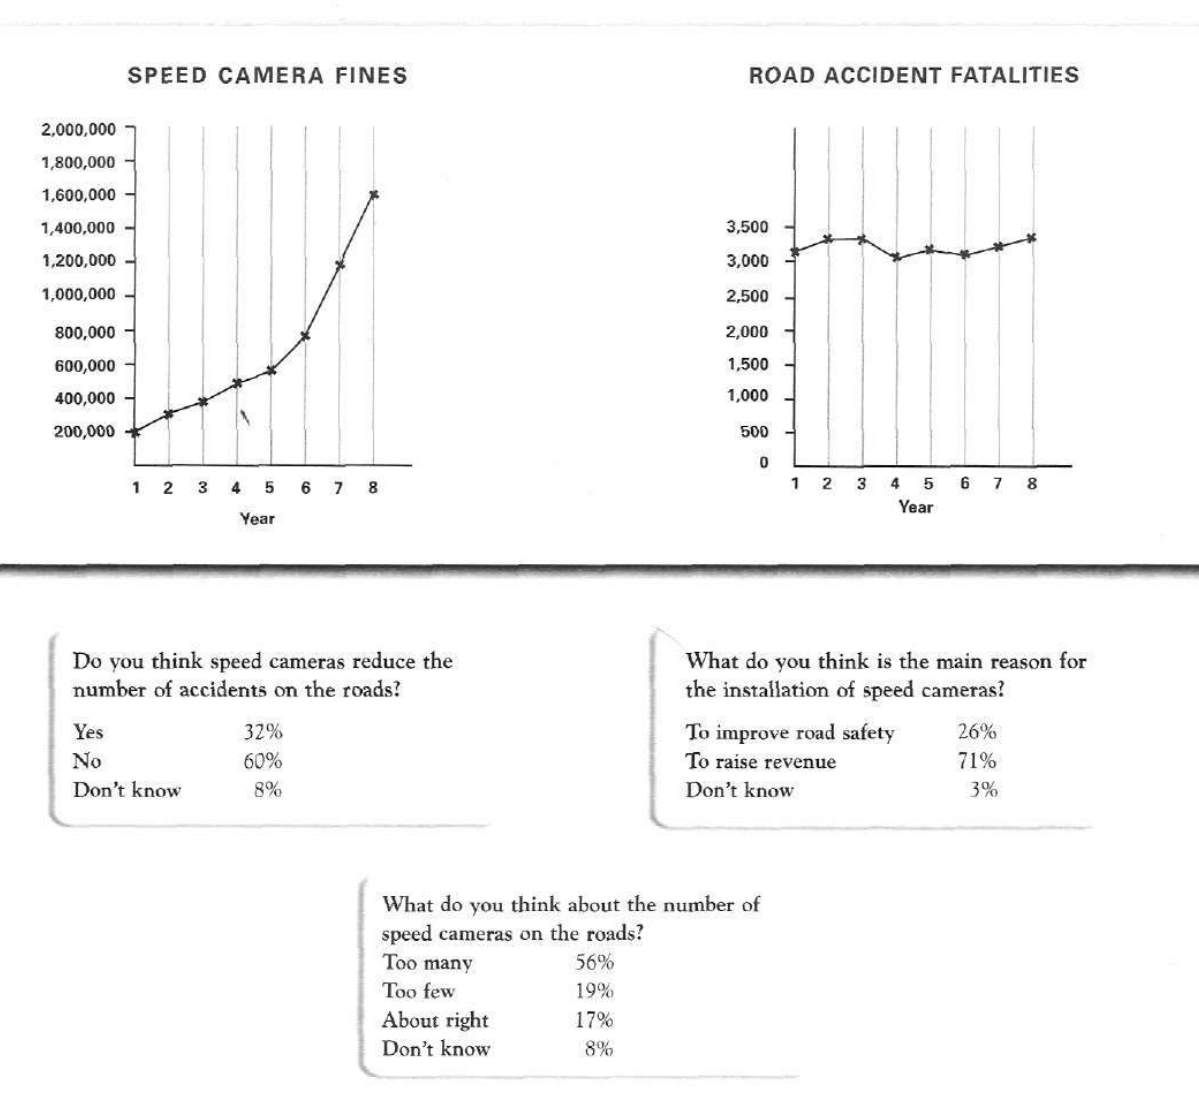
The graphs below show the number of drivers in Britain who have been caught driving too fast by speed cameras placed on roads, and the number of people killed in road accidents, over an eight-year period since the introduction of speed cameras. The tables show the results of a survey on people's opinions on speed cameras.
Write a report for a university lecturer describing the information below.
SPEED CAMERA FINES and ROAD ACCIDENT FATALITIES
Student answer (Band 6.0)
The line graphs below illustrate the number of speed camera fines and road acccident deaths in britain over a period of eight years. The tables indicates are responses from the public on speed cameras .
Overall, since the introduction of speed cameras the number of fines has been on an upward trajectory whilst number of deaths have been approximately above three thousand every year .Most people believe that speed cameras are not reducing number of deaths and only there to raise revenue.
The eighth year recorded high figures for both road related accidents at approximately three thousand five hundred and 1.6 million fines collected. ln converse the lowest figures recorded were on the first year of installation with about two hundred thousand fines and just above three thousand deaths.
Surveys done show that just over a half of the people interviewed don't agree that speed cameras reduce accidents on the roads, with nearly three quaters responding that the main reason for speed camera instalation is to raise revenue . 56% of individuals say that very many speed cameras have been placed on the roads.
AI examiner evaluation
| Criterion | Band |
|---|---|
| Task Achievement / Task Response | 6.5 |
| Coherence and Cohesion | 6.5 |
| Lexical Resource | 6.0 |
| Grammatical Range and Accuracy | 5.5 |
| Overall | 6.0 |
Task Achievement / Task Response: Band 6.5
You cover the main elements of the visuals and provide a clear overview: fines rose substantially, while fatalities stayed above 3,000, and respondents were generally sceptical about cameras. The figures you select are mostly accurate, including 1.6 million fines in year eight and the survey’s 60% who said cameras do not reduce accidents. However, the overview’s claim that cameras are “only there to raise revenue” presents a survey opinion as fact. Also, year eight’s 3,350 refers to fatalities, not road accidents, and the lowest fatality figure was about 3,100 in year four, rather than year one. You identify the key patterns, but more precise comparisons and fuller coverage of the changing fatality figures would strengthen the report.
Coherence and Cohesion: Band 6.5
The response has a recognisable report structure: an introduction, an overview, a paragraph on the graphs, and one on survey findings. This gives the information a generally logical order, and linking expressions such as “Overall” and “whilst” help signal relationships. The progression is not always smooth, however. “The eighth year recorded high figures for both…” combines two different measures without clearly distinguishing fines from fatalities, and “ln converse” makes the comparison difficult to follow. The survey paragraph also moves through results without clearly separating the three questions. Use clearer topic sentences and explicit comparisons, for example, discuss the fines trend and the relatively stable fatalities separately, then group the survey results by question.
Lexical Resource: Band 6.0
You use a reasonable range of task-related vocabulary, including “upward trajectory,” “approximately,” “responding,” and “installation.” These choices help convey trends and survey results, and the meaning is generally clear. Some expressions are imprecise or unnatural for describing data: “road related accidents” is used where the chart reports fatalities, “very many speed cameras” is not an appropriate rendering of “too many,” and “fines collected” suggests revenue rather than the number of fines. There are also spelling and form slips, including “acccident,” “quaters,” and “instalation.” Aim for precise chart language and check spelling; terms such as “fatalities,” “the proportion of respondents,” and “the number of fines issued” would improve accuracy and register.
Grammatical Range and Accuracy: Band 5.5
You attempt both simple and more complex sentence forms, including the contrast in “fines has been on an upward trajectory whilst number of deaths…” and the longer survey sentence beginning “Surveys done show that…”. The overall meaning remains understandable, but some errors in agreement, articles, and sentence construction reduce accuracy. For example, “The tables indicates” should use a plural verb, while “whilst number of deaths” needs an article or determiner. “The lowest figures recorded were on the first year” has an awkward grammatical pattern, and the final sentence would be clearer as “56% of individuals say there are too many speed cameras.” Check subject–verb agreement and articles, and use complete, controlled clauses when comparing data.
See this exact question answered at other band scores. The same prompt compared across bands.
Browse more IELTS Writing model answers or get your own writing scored by the same AI examiner.