Band 5.5 IELTS Writing Task 1 Model Answer
Overall Band Score: 5.5 · IELTS Complete Catalyst · 2026-11-06
IELTS Writing Task 1 question
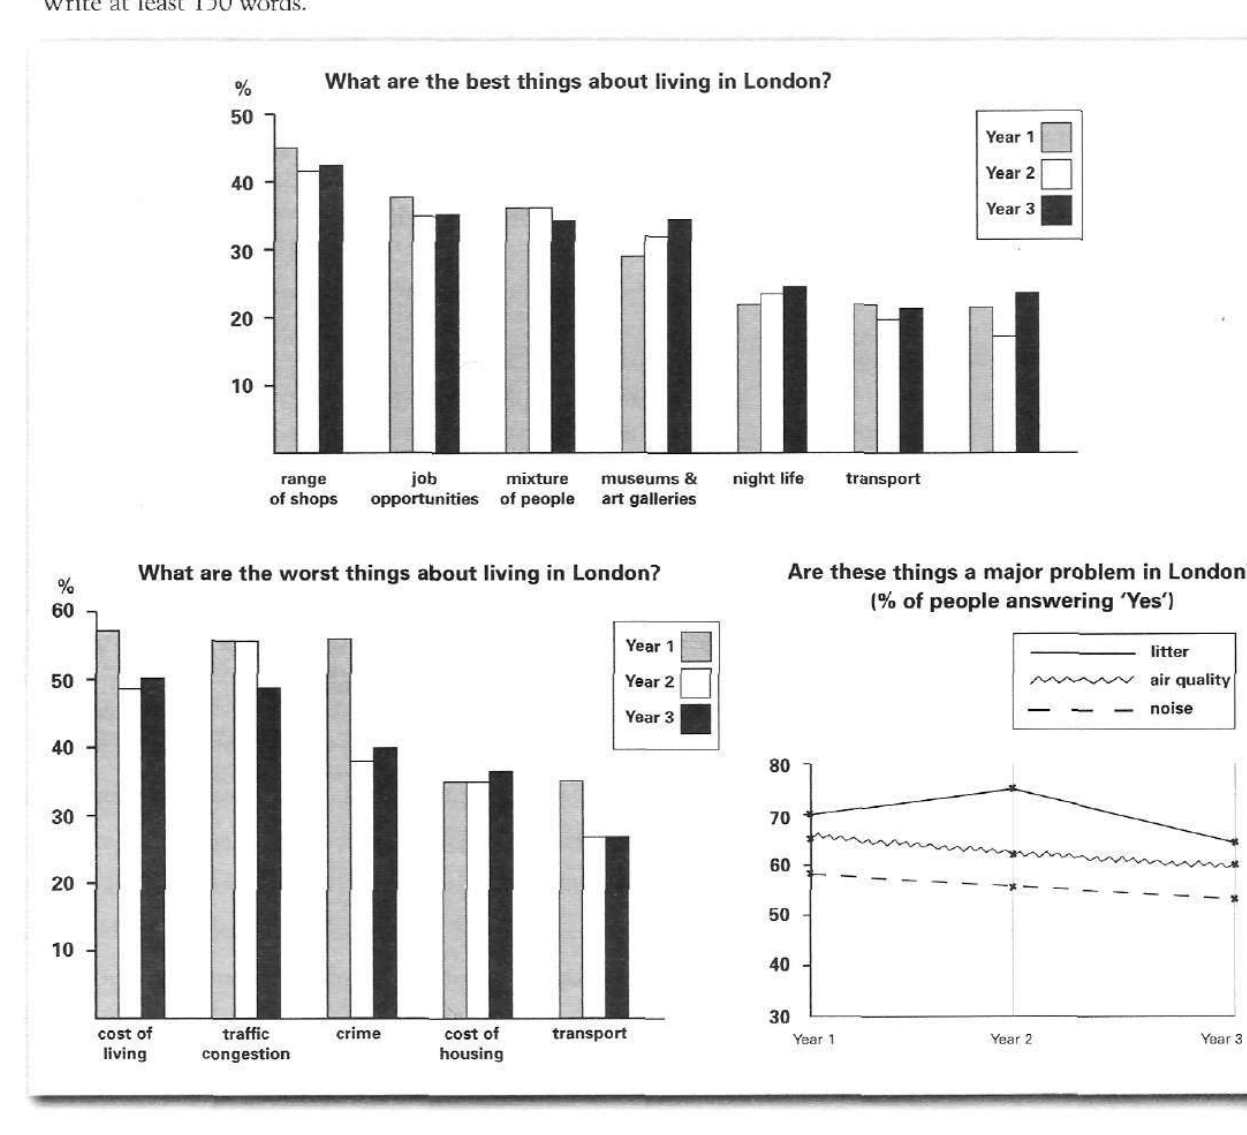
The bar charts and line graph below show the results of a survey conducted over a three-year period to discover what people who live in London think of the city.
Write a report for a university lecturer describing the information below.
What are the best things about living in London?
Student answer (Band 5.5)
The bar chart and line graph illustrates the report of a three-year survey. It describes views of people about the London city.
Overall, the bar charts and line graph presented the best and worst things from their experiences. It also described a major problem in London like litter, air quality and noise.
Firstly, the worst things include cost of living and housing, traffic congestion, crime rate and transport facilities. People gave different opinions in three years. The cost of living,traffic congestion and crime rate has decreased. The cost of housing has slightly increased. The transport facility has decreased.
The major problem of litter increased and then decreased.Air quality has decreased in three years. And the noise has also decreased in three years.
The best things include range of shops, job opportunities,different people, museums and art galleries,night life and transport facilities. Interests in museums and art galleries have increased in three years. Job opportunities, range of shops, mixture of people, and transport facilities have slighly decreased. Interest in night life has also increased in three years.
To summarize, best things are more than the worst things. People gave opinions about major problems in London.
AI examiner evaluation
| Criterion | Band |
|---|---|
| Task Achievement / Task Response | 5.5 |
| Coherence and Cohesion | 6.0 |
| Lexical Resource | 5.5 |
| Grammatical Range and Accuracy | 5.5 |
| Overall | 5.5 |
Task Achievement / Task Response: Band 5.5
You cover the three chart components and identify several relevant trends, including the rise and subsequent fall in concern about litter and the increases for museums and nightlife. However, the report is largely general: it gives almost no figures and does not clearly compare the most and least popular responses. Some trend statements are inaccurate or too broad. For example, cost of living and crime fall overall but rise slightly again in Year 3, while the mixture of people does not decrease throughout; it is unchanged before falling. The closing claim that the best things are “more than” the worst things is unclear and unsupported. A clearer overview and a few accurate figures for key highs, lows and changes would make the information more fully reported and precise.
Coherence and Cohesion: Band 6.0
The response has a recognisable structure: an introduction, an overview, separate paragraphs for the negative and positive features, and a concluding sentence. This makes the main categories easy to locate. The sequence within paragraphs is generally understandable, and words such as “Overall,” “Firstly” and “To summarize” signal stages of the report. However, progression is sometimes mechanical, with repeated sentence openings such as “The… has decreased” and “The… has increased.” The overview also repeats the chart’s subject rather than summarising its main patterns, and the final sentence does not follow clearly from the data. Grouping related trends and using clearer comparisons between years would improve cohesion and the flow of information.
Lexical Resource: Band 5.5
You use enough topic vocabulary to identify the chart categories, including “traffic congestion,” “air quality,” “job opportunities” and “museums and art galleries.” This helps communicate the general subject. However, the range is limited and several expressions are imprecise or repetitive, such as “major problem,” “facilities” and repeated use of “increased” and “decreased.” Some collocations are unnatural, including “views of people about the London city” and “People gave different opinions.” Spelling errors such as “slighly” also reduce accuracy. Aim for more precise language for describing survey responses and trends, while keeping the chart’s labels consistent; this will make comparisons clearer and more natural.
Grammatical Range and Accuracy: Band 5.5
You use mostly straightforward sentences, with some attempts to link ideas, and the overall meaning is generally clear. However, there are recurring errors in agreement, tense and sentence construction. For example, “The bar chart and line graph illustrates” needs a plural verb, while “the cost of living, traffic congestion and crime rate has decreased” has a plural subject. The report shifts between past and present forms, although the survey covers three completed years, and “The major problem of litter increased and then decreased.Air quality…” needs clearer sentence separation and punctuation. Articles and plural forms are also inconsistent. Practise accurate past-tense reporting and subject–verb agreement, and combine short statements into controlled comparisons to show a wider range of sentence forms.
See this exact question answered at other band scores. The same prompt compared across bands.
Browse more IELTS Writing model answers or get your own writing scored by the same AI examiner.