Band 6.0 IELTS Writing Task 1 Model Answer
Overall Band Score: 6.0 · IELTS Complete Catalyst · 2026-11-08
IELTS Writing Task 1 question
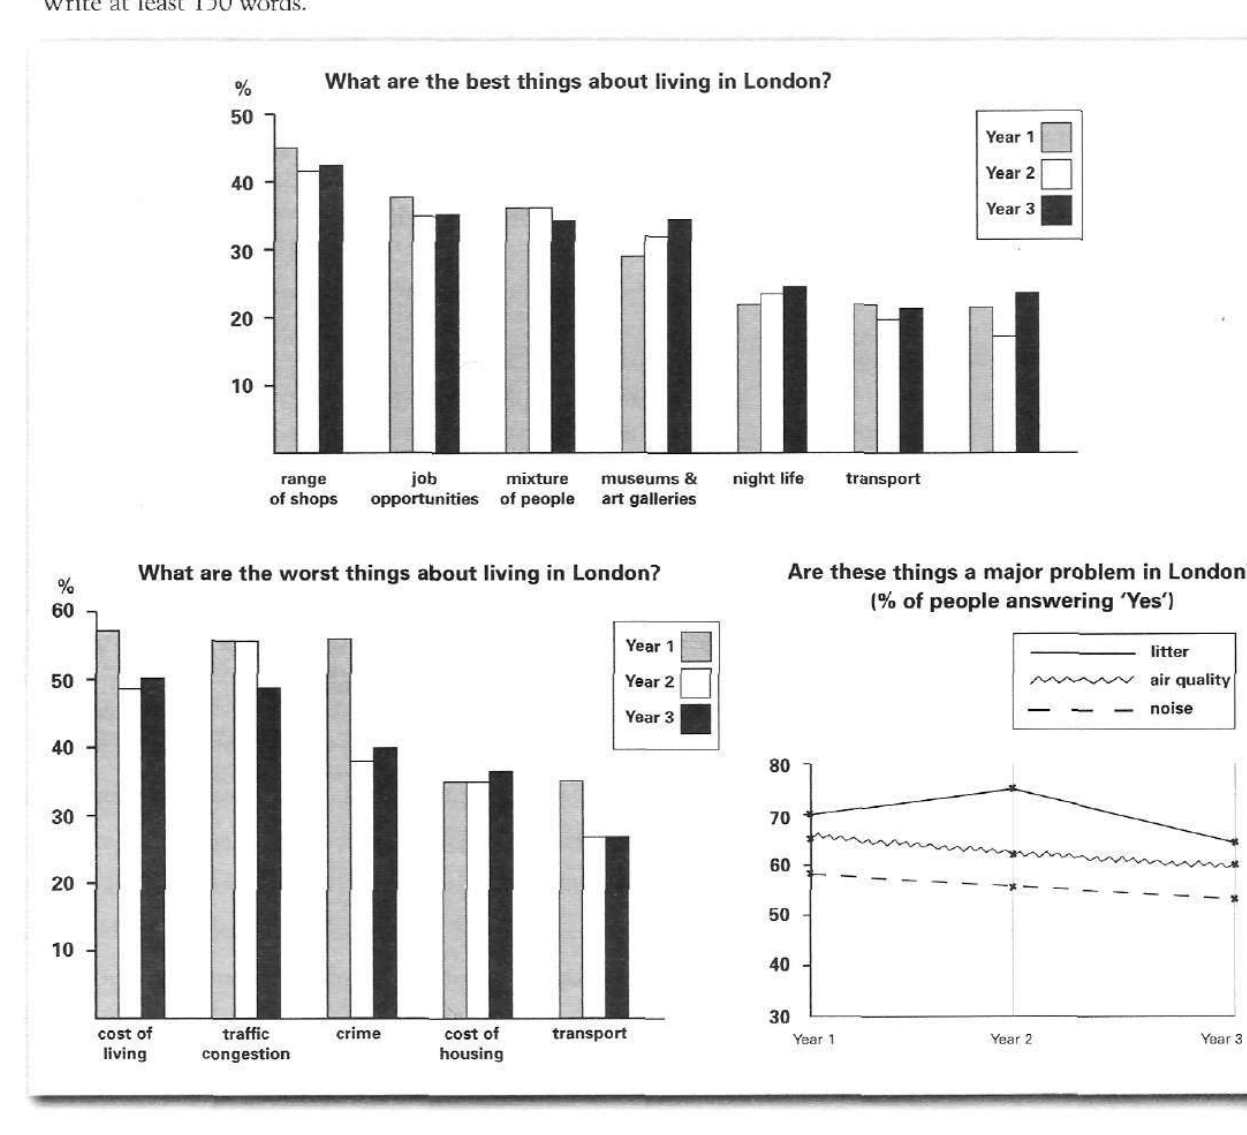
The bar charts and line graph below show the results of a survey conducted over a three-year period to discover what people who live in London think of the city.
Write a report for a university lecturer describing the information below.
What are the best things about living in London?
Student answer (Band 6.0)
In the following text i will descriptively descripe the results of the three given graphics and give my own interpretation for the results. My own interpretation are just assumptions and not reasons. The first graphic analyzed are the results about the best things about living in London. The second graphic is the opposite. These are the results for the worst things about living in London. The third one is a graphic about the percentage of people who think that these given examples are a major problem in London.
Based on the given information overall the best three best things in London are the range of shops, the job opportunities adn the mixture of people. Thats the result of the last three years. The range of shops is compared to the others the best thing. In all three years there were constantly over 40% of the people voting for that as the best thing about living in london. The second best thing are the job opportunities. Over the last three years constantly over 35% voted for that for the second best thing about living in london. A good reason for that could be good wages compared to other countries in europe or good learning opportunities in industries like Banking and Finance. The third best thing is the mixture of people, it has about 35% of the votes in Year 1 to Year 3. Reason for that could be different Jobs opportunities, different parts to live in and different cultures respresenting different countries. The graphic doesnt show anything about the types of voters neither the origin country and culture of the voters.
The second graphic is showing the worst things about living in London. The first one is the cost of living with about 48% constantly over the last three years. Reasons for that could be inflation, rising rent in the city or rising prices in grocery stores or shopping centres. The second worst thing is the traffic congestion with about 55% person of the votes in year 1 and 2 and 48% of the votes in year 3. Reason for that could be bad coordination of traffic in the city, the amount of cars and the amount of demand exceeding the supply of drivers and cars. The third worst thing according to the voters is crime. It has about 58% of the votes in the first year and 38% and 40% of the votes in year 2 and 3. Reasons for that could be too much incentive for people to do crimes. For instance providing low wages to the majority of the jobs that the people cant have a high quality life standard and as a consequence have an incentive to do a crime to improve their cash balance in the bank. In the given information there are no reasons provided for the results of the voters. Therefore my interpretation are just assumptions and not the real reasons for the results of the worst and best things the voters voted for.
The third grapic shows that 70% in the first year, 75% in the second year and 65% of the people in the third year think that litter is a major problem in London. In addition to that it shows that 65% in the first year and slightly over 60% in the last year think that the air quality in London is a major problem. That curve is constantly decreasing over the last three years according to the voters. It shows that the voters think that noise isnt a major problem in London. The exact results are constantly under 60% in the last three Years.
AI examiner evaluation
| Criterion | Band |
|---|---|
| Task Achievement / Task Response | 6.0 |
| Coherence and Cohesion | 6.5 |
| Lexical Resource | 6.0 |
| Grammatical Range and Accuracy | 5.5 |
| Overall | 6.0 |
Task Achievement / Task Response: Band 6.0
You cover all three visuals and identify several important features, including the range of shops as the leading positive feature, traffic congestion as a major drawback, and litter as a prominent problem. Many figures are broadly accurate. However, some comparisons are misreported: crime is about 56% in Year 1, not 58%, and the cost of living is about 57%, 49% and 50%, rather than “about 48% constantly.” The overview is also incomplete: it should summarise the main patterns across all charts, including the general decline in reported air-quality and noise problems. Much of the report speculates about causes and includes personal interpretation, which the task does not ask for; use that space to compare the data more fully, especially the less-discussed positive and negative categories.
Coherence and Cohesion: Band 6.5
The response has a clear overall sequence: an introduction, discussion of the positive features, the negative features, and then the problems chart. Paragraphing helps the reader follow the three visuals, and signposting such as “The second graphic” makes the organisation explicit. This meets the lower-band expectation of a coherent arrangement and shows some stronger progression. However, cohesion is sometimes mechanical because “Reason for that could be” and repeated references to “the graphic” recur, while the long explanations of possible causes interrupt the data-focused progression. Some references are also unclear, as in “That curve” when no curve has been identified. To strengthen the flow, group comparisons by trend or rank, use concise linking phrases, and keep each paragraph focused on reported figures.
Lexical Resource: Band 6.0
You use an adequate range of topic vocabulary, including “job opportunities,” “traffic congestion,” “air quality,” and “major problem,” so the main information is generally clear. There are also attempts at more specific language, such as “exceeding the supply” and “incentive.” However, some word choices and collocations are inaccurate or unsuitable for a formal data report: “descriptively descripe,” “the best three best things,” “person of the votes,” and “cash balance in the bank.” Spelling errors such as “adn,” “grapic,” and “respresenting” also reduce accuracy. Prefer precise reporting language—“accounted for,” “stood at,” or “was the most frequently cited”—and avoid speculative or conversational expressions. This would make the vocabulary more controlled and appropriate to the task.
Grammatical Range and Accuracy: Band 5.5
You attempt both simple and complex sentence forms, including clauses with “because,” “which,” and “therefore,” and the meaning is usually understandable. Some sentences are controlled, for example, “The third graphic shows that 70% in the first year…” However, errors in agreement, articles, tense, and sentence construction remain: “My own interpretation are,” “The first graphic analyzed are,” and “The second graphic is showing” are not well formed. There are also run-on or awkwardly joined sentences, particularly in the explanations of possible causes, and punctuation is inconsistent. Aim for shorter, complete sentences and check subject–verb agreement and article use. A more consistent present tense for describing chart data would also improve grammatical control.
See this exact question answered at other band scores. The same prompt compared across bands.
Browse more IELTS Writing model answers or get your own writing scored by the same AI examiner.