Band 5.5 IELTS Writing Task 1 Model Answer
Overall Band Score: 5.5 · IELTS Complete Catalyst · 2026-11-10
IELTS Writing Task 1 question
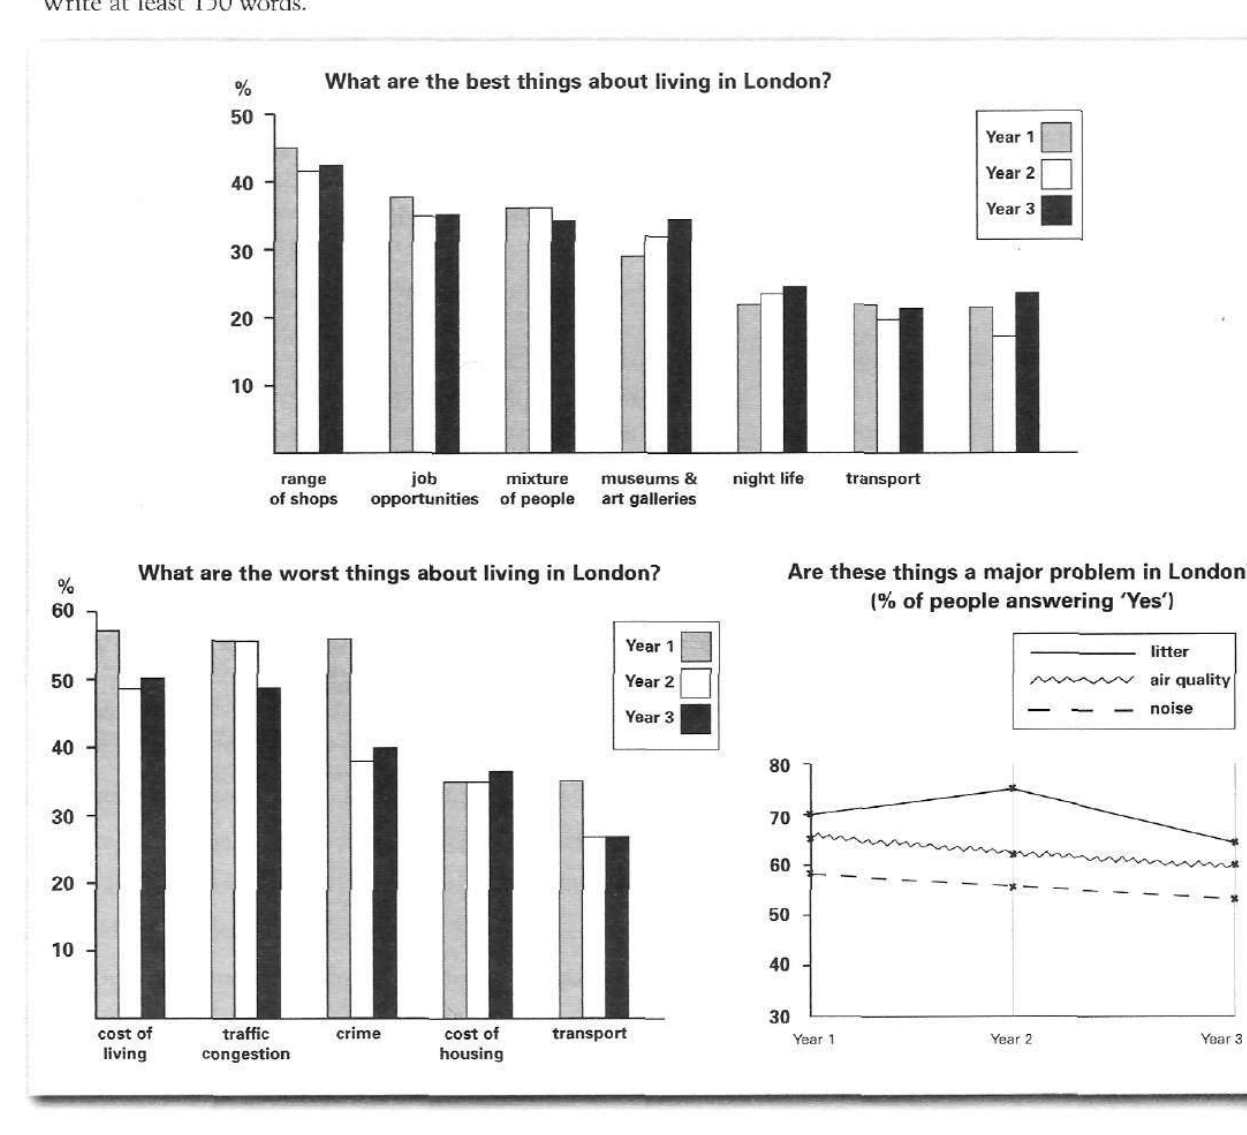
The bar charts and line graph below show the results of a survey conducted over a three-year period to discover what people who live in London think of the city.
Write a report for a university lecturer describing the information below.
What are the best things about living in London?
Student answer (Band 5.5)
The charts and graph show data from a three year survey conducted on what residents of London think about the city.
Overall, the range of shops was rated as the best thing about living in london, while traffic congestion was chosen as the worst thing for consecutive years. Lesser people chose air quality and noise as a major problem in London in following years while More people chose Litter
Range of shops saw a decline from 45% in first year to around 42% in second year and back to 43% in the third. Similarly transport went from around 22% to 20% and back to 21%. Job opportunities saw a decline from around 37% in first to 35% in both year two and three. Mixture of people similarly went down from 35% in first two years to 33%. Museums & art gallaries rose in the second and third year from 29% to 31% and 35% respectively, similarly night life increased from 23% to 25% and 27% respectively.
Cost of living was chosen as the worst thing about living in London in the first year at around 68%, while in consevutive years it declined to 48% and 50% respectively. Trafic congestion was ranked second for first two years at around 65% before dropping to 48% in third year. Similarly crime was chosen at 67% for first year while dropping to less than 40% in consecutive years.
Litter was chosen as major problem in London at 70% rising to 75% in second year hwil
AI examiner evaluation
| Criterion | Band |
|---|---|
| Task Achievement / Task Response | 5.0 |
| Coherence and Cohesion | 5.5 |
| Lexical Resource | 5.5 |
| Grammatical Range and Accuracy | 5.5 |
| Overall | 5.5 |
Task Achievement / Task Response: Band 5.0
You identify the main positive feature—shops—and discuss several trends across the three charts, so the report is relevant. However, the coverage is partial and some key figures are substantially inaccurate: cost of living is reported as 68% in Year 1, rather than about 57%, and traffic congestion as 65%, rather than about 56%. The overview also says congestion was the worst choice in consecutive years, although cost of living was slightly higher in Year 1 and congestion was highest only in Year 2. The final section is cut off after the litter figures, leaving the air-quality and noise trends without supporting detail. Select the main comparisons accurately and complete the overview and final chart description.
Coherence and Cohesion: Band 5.5
The response has a recognisable report structure: an introduction, an overview, and paragraphs covering the positive and negative features. Grouping the information by chart helps the reader follow the topic, and words such as “Similarly” and “while” attempt to connect comparisons. However, the progression is weakened by a long sequence of figures with little prioritisation, and the final paragraph ends abruptly at “hwil,” leaving the last chart incomplete. Some links are also unclear—for example, “Mixture of people similarly went down from 35% in first two years to 33%” does not clearly distinguish the three years. Use clearer topic sentences, make comparisons explicit, and ensure the report has a complete ending.
Lexical Resource: Band 5.5
You use relevant vocabulary for describing charts, including “decline,” “rose,” “ranked,” and “major problem,” and the meaning is generally understandable. However, the range is limited and some choices or forms are inaccurate or awkward, such as “Lesser people chose,” “consecutive years” where you mean subsequent years, and “was chosen as the worst thing” repeated across the report. There are also noticeable spelling errors, including “gallaries,” “consevutive,” and “Trafic,” which reduce precision. Aim for more varied, natural reporting language and check spelling carefully. For example, describe percentages as the proportion of respondents who “identified” or “regarded” an item as a feature or problem.
Grammatical Range and Accuracy: Band 5.5
You attempt a mixture of simple and more complex sentences, including comparisons with “while” and “similarly,” and most of the main points can be understood. However, errors recur in sentence construction and punctuation. For example, “Mixture of people similarly went down from 35% in first two years to 33%” lacks clear grammatical framing and does not express the year-by-year change accurately; “in first year” also needs an article. Capitalisation is inconsistent in “london,” “More,” and “Litter,” and the final sentence is incomplete. Use complete sentences, check articles and plural forms, and punctuate the overview and comparisons consistently.
See this exact question answered at other band scores. The same prompt compared across bands.
Browse more IELTS Writing model answers or get your own writing scored by the same AI examiner.