Band 6.0 IELTS Writing Task 1 Model Answer
Overall Band Score: 6.0 · IELTS Complete Catalyst · 2026-11-11
IELTS Writing Task 1 question
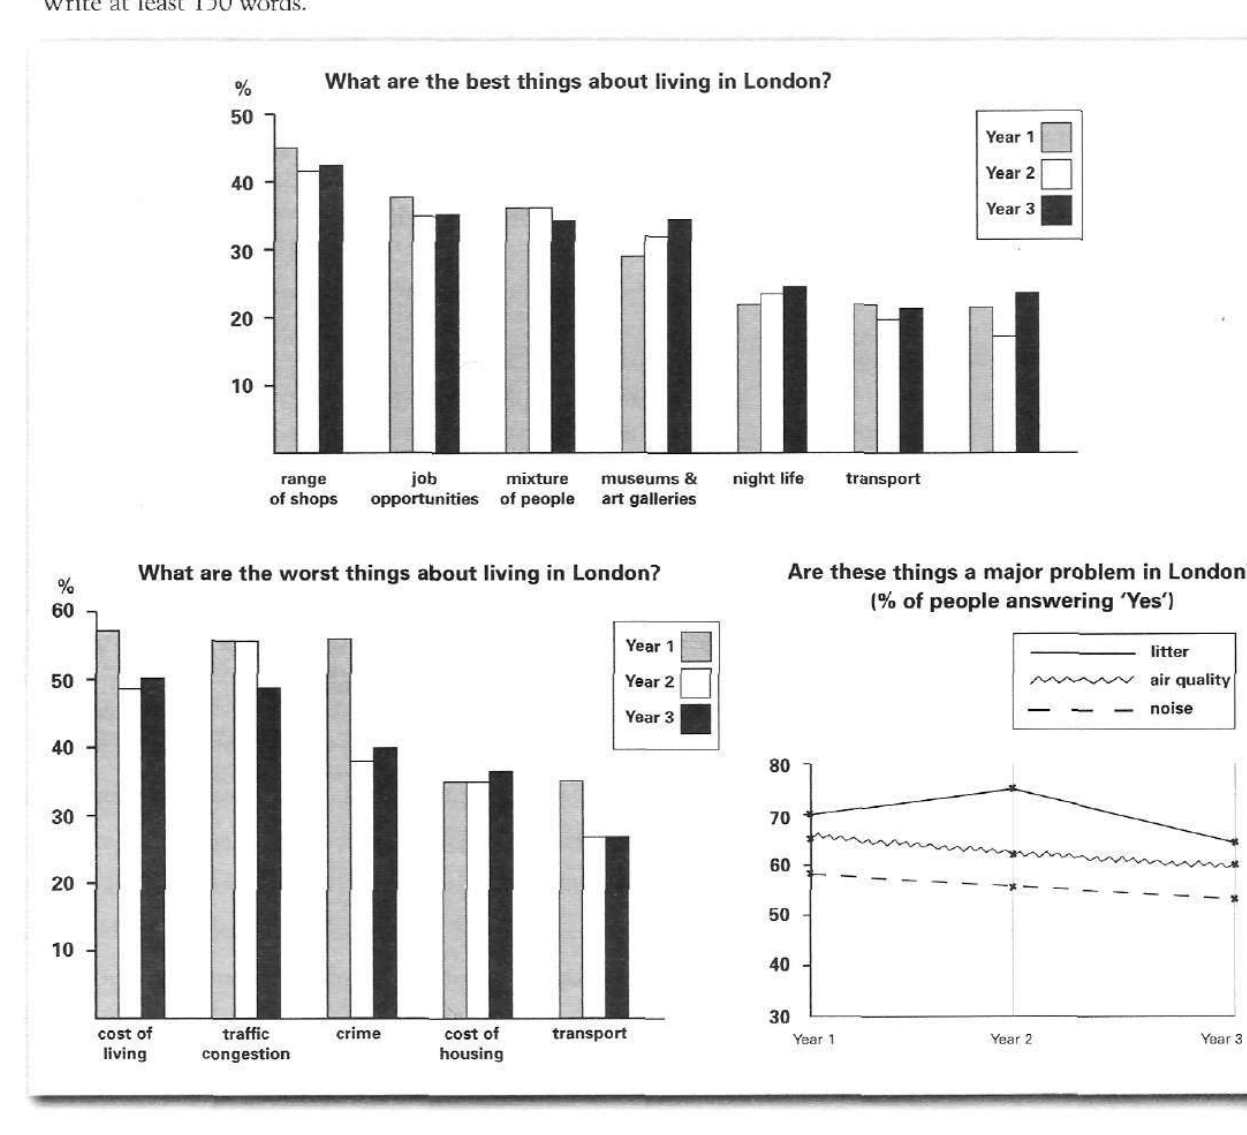
The bar charts and line graph below show the results of a survey conducted over a three-year period to discover what people who live in London think of the city.
Write a report for a university lecturer describing the information below.
What are the best things about living in London?
Student answer (Band 6.0)
The picture represents two bar charts and one line graph. The bar charts provide information about best and worst things about living in London, while line graph describes major problems in London according to its people.
The first bar chart represents the best things about living in London and contains different factors with range of shops being top of the list over all three years. The chart represents a steady opinion of people about what they think is best with minor fluctuations over these years.
The second graph is about the worst things about living in London with almost similar steady trend except for crime rate; which was the highest in first year of the survey. The line graph discusses three major problems: litter, air quality, and noise. According to people litter is the highest among all three years but there's a downtrend after year two reflecting improvement. Above 60% people think that air quality is the major issue while less than 60% people think noise is the major issue.
AI examiner evaluation
| Criterion | Band |
|---|---|
| Task Achievement / Task Response | 5.5 |
| Coherence and Cohesion | 6.5 |
| Lexical Resource | 6.0 |
| Grammatical Range and Accuracy | 6.0 |
| Overall | 6.0 |
Task Achievement / Task Response: Band 5.5
You identify all three visuals and give a broad overview of several key patterns, including shops as the leading positive feature and litter as the most prominent problem. However, the report is only partially developed: it gives almost no figures, so comparisons across the years are difficult to verify. Some claims are also inaccurate or too broad. Crime was not the highest worst feature in Year 1: cost of living was about 57%, crime 56%, and traffic congestion 55.5%. The statement that air quality is above 60% in all years is not accurate, as it falls to about 60% in Year 3. Include selected figures and describe notable changes, such as the fall in crime and the rise in litter to Year 2 followed by a decline.
Coherence and Cohesion: Band 6.5
The response has a clear overall sequence: it introduces the visuals, then discusses the positive features, the negative features, and finally the line graph. This makes the main topics easy to follow, and phrases such as “The first bar chart” and “The line graph” help signal shifts. The organisation is coherent, but the report is compressed into a series of short paragraphs with limited development or comparison between categories. Some links are also slightly mechanical, and the semicolon before “which” interrupts the sentence rather than clarifying its relationship to the preceding clause. To strengthen progression, group related comparisons and use linking language to show contrasts or changes across years, rather than mainly listing each visual in turn.
Lexical Resource: Band 6.0
You use an adequate range of task-related vocabulary, including “steady opinion,” “minor fluctuations,” “downtrend,” and “major issue,” and the meaning is generally clear. There is some attempt to vary wording, but several choices are imprecise or repetitive: “represents” appears repeatedly, and “steady trend” does not capture the more noticeable changes in some categories. “Crime rate” is also not the chart’s exact label; “crime” is safer unless the data specifically measures a rate. Aim for more precise language for describing data and use a wider range of comparison verbs and nouns. For example, describe figures as rising, falling, remaining stable, or ranking highest, and use “proportion” when referring to percentages.
Grammatical Range and Accuracy: Band 6.0
You use a mix of simple and more complex sentence forms, and most sentences communicate their meaning clearly. The opening sentence combines the chart types and their subjects effectively, while the final sentence contrasts views on air quality and noise. Some grammatical errors remain. Articles are missing in “while line graph describes” and “According to people litter,” and the phrase “over all three years” would be more naturally formed as “in all three years.” The clause “except for crime rate; which was…” is incorrectly punctuated: a semicolon should not separate the noun phrase from its defining clause. Check articles and punctuation, and vary sentence structures while keeping comparisons grammatically complete.
See this exact question answered at other band scores. The same prompt compared across bands.
Browse more IELTS Writing model answers or get your own writing scored by the same AI examiner.