Band 5.0 IELTS Writing Task 1 Model Answer
Overall Band Score: 5.0 · IELTS Complete Catalyst · 2026-11-12
IELTS Writing Task 1 question
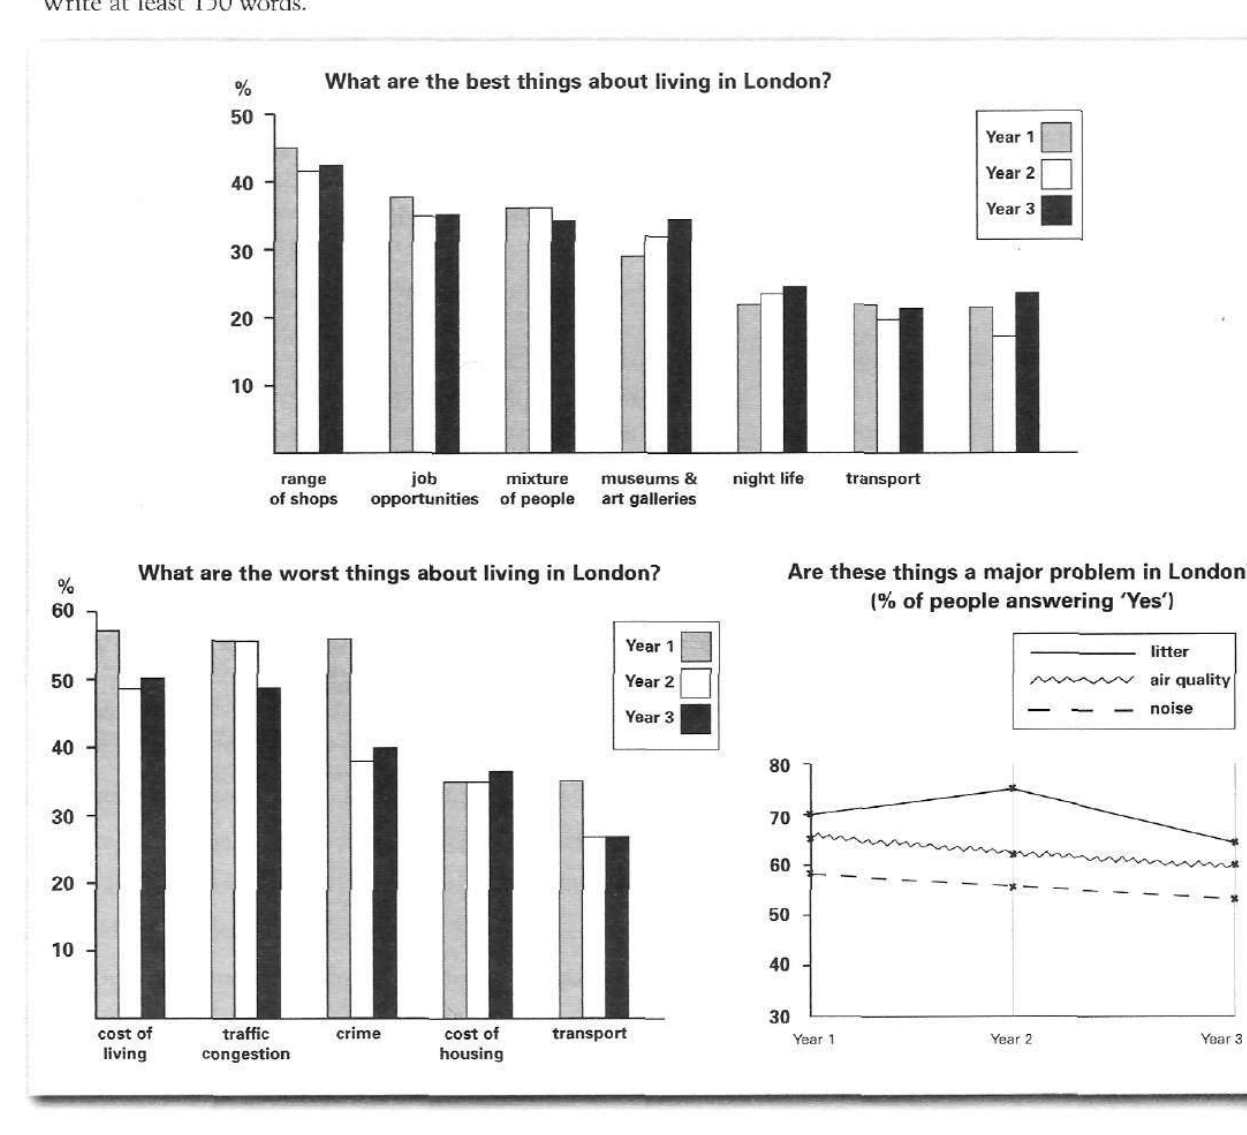
The bar charts and line graph below show the results of a survey conducted over a three-year period to discover what people who live in London think of the city.
Write a report for a university lecturer describing the information below.
What are the best things about living in London?
Student answer (Band 5.0)
The bar charts illustrate survey about the best and worst things about living in London over three periods and the line chart drecribes the major problem in london measured in percentage.
Overall , in bar chart the best thing about london was range of shops while the worst things were cost of living, traffic jam over the over the three periods. The worst things abount living in london were substantial than good things. In line graph all of the problems were considerably at higher level over the fillowing uears.
By looking at bar charts, range of shopping was at highest level of good things about London over the tree periods at avobe 40%, around 42% and 43% respectively. Following by job opportunities , mixture of people and musueums and art galleries were at simillar level between just under 50% to just under 40% whole night life and transport were least popular ober the uears
AI examiner evaluation
| Criterion | Band |
|---|---|
| Task Achievement / Task Response | 4.5 |
| Coherence and Cohesion | 5.5 |
| Lexical Resource | 5.0 |
| Grammatical Range and Accuracy | 5.0 |
| Overall | 5.0 |
Task Achievement / Task Response: Band 4.5
You identify the broad topic and give an overview, noting that shops were the leading positive feature and that living costs and traffic were major drawbacks. However, the report covers only the positive bar chart in detail and does not describe the negative-feature figures or the line graph’s results. The claim that the worst things were “substantial than good things” is unclear and not supported by a direct comparison, while the line-graph overview merely says problems were at a high level. Some figures for shops are broadly accurate, but the comparison of job opportunities, diversity and museums is imprecise: these categories do not all sit between just under 50% and just under 40%. To improve, summarise all three visuals and select accurate key comparisons and trends.
Coherence and Cohesion: Band 5.5
The response has a recognisable structure: an introduction, an overview and a paragraph describing positive features. This gives the reader some sense of organisation, and phrases such as “Overall” and “By looking at bar charts” signal the stages of the report. However, the progression is incomplete because the final paragraph stops after the positive chart, leaving the negative chart and line graph without a developed account. Several links are awkward or unclear, including “Following by job opportunities” and “while night life and transport,” and repeated wording such as “over the three periods” does not create clear comparisons. Use separate, purposeful paragraphs for the overview and the main data groups, and connect comparisons with precise linking phrases.
Lexical Resource: Band 5.0
You use some relevant chart vocabulary, including “survey,” “percentage,” “range of shops,” “job opportunities” and “line graph,” so the topic is generally identifiable. There are also attempts at more descriptive language, such as “highest level” and “least popular.” However, the range is limited and several word choices or collocations are inaccurate or unclear: “major problem … measured in percentage,” “substantial than good things,” and “at simillar level” do not express the intended comparisons naturally. Spelling errors such as “drecribes,” “musueums,” “uears” and “avobe” are noticeable and sometimes slow the reader. Build a bank of accurate reporting phrases, for example “accounted for,” “remained relatively stable,” and “was the most frequently cited advantage.”
Grammatical Range and Accuracy: Band 5.0
You attempt both simple and more extended sentences, and the opening sentence tries to distinguish the bar charts from the line graph. However, grammatical control is inconsistent, and errors frequently make relationships difficult to follow. For example, “The bar charts illustrate survey” is missing an article, while “the best thing … was range of shops” has problems with number and article use. The overview sentence “The worst things … were substantial than good things” lacks a clear grammatical comparison, and “Following by job opportunities” is not a complete clause. Punctuation and spacing are also uneven. Practise forming complete comparison sentences with accurate subjects and verbs, such as “The range of shops was the most popular advantage in all three years,” before attempting longer structures.
See this exact question answered at other band scores. The same prompt compared across bands.
Browse more IELTS Writing model answers or get your own writing scored by the same AI examiner.