Band 5.0 IELTS Writing Task 1 Model Answer
Overall Band Score: 5.0 · IELTS Complete Catalyst · 2026-11-12
IELTS Writing Task 1 question
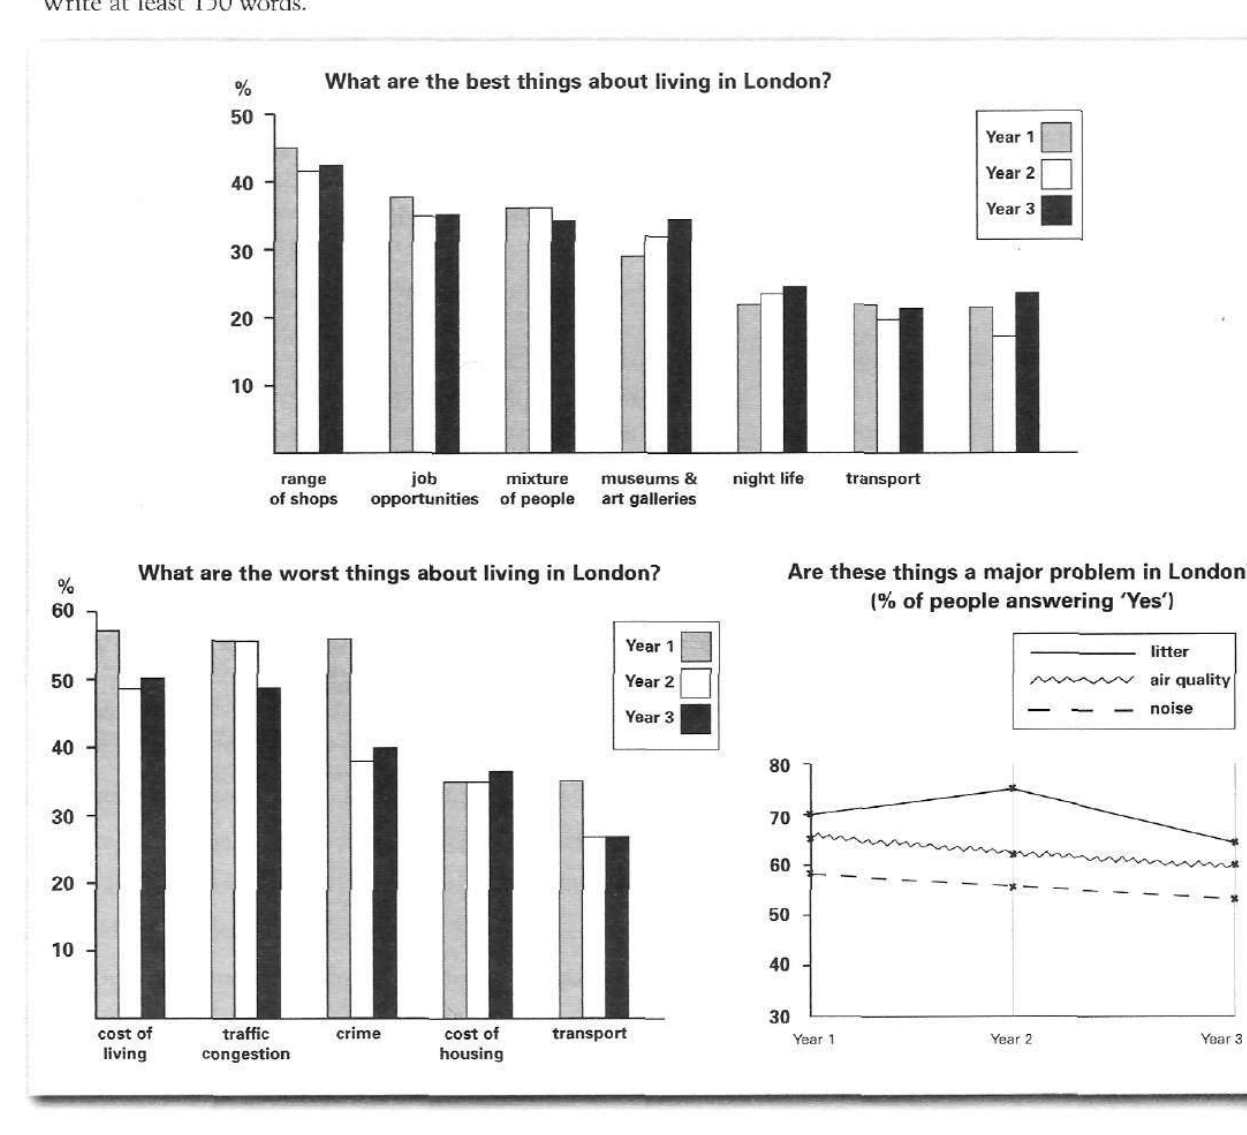
The bar charts and line graph below show the results of a survey conducted over a three-year period to discover what people who live in London think of the city.
Write a report for a university lecturer describing the information below.
What are the best things about living in London?
Student answer (Band 5.0)
The column graph illustrate the result about survey that conducted during three different acdamic years where thought and live for UK cities.
Overall,it can be seen that the range of shops was much higher for better things or lessen in the number of transport.While in bad things traffic congestion is munch higher then the houses for renting.
On the one hand,range of shops much higher almost 50 percent as compared to transport or job opportunities that will be 20 percent or 40 percent .Furthermore, there are many others good things in three years,there will be 45 percent mixture of people in better things or museums will be 35 percent ar compared to people who spend for night life has 25 percent.
While there are different bad things like crime rate has gone to peak and will be 59 percent in three different years as compared to traffic congestion or the cost for renting houses will be 62 or 45 percent.The cost for transport or living standared will lise in 60 percent 32 percent.
AI examiner evaluation
| Criterion | Band |
|---|---|
| Task Achievement / Task Response | 4.5 |
| Coherence and Cohesion | 5.5 |
| Lexical Resource | 5.0 |
| Grammatical Range and Accuracy | 5.0 |
| Overall | 5.0 |
Task Achievement / Task Response: Band 4.5
You identify several relevant categories and attempt an overview, noting that shops are a leading positive feature and congestion is a major drawback. However, the report only partially describes the charts: it omits the separate chart on whether litter, air quality and noise are major problems, and several comparisons are inaccurate or unclear. For example, shops are about 42–45%, not “almost 50,” while transport is around 20–22%; the figures for mixture of people and museums are also reversed or misrepresented. The claims that crime “has gone to peak” and that housing costs are 62% do not match the data. To strengthen the report, summarise all three visuals and select a few accurate comparisons and trends.
Coherence and Cohesion: Band 5.5
The response has a basic structure: an opening, an overview, and two paragraphs introduced by “On the one hand” and “While.” These markers help the reader recognise a shift from positive to negative features. However, progression within the paragraphs is difficult to follow because several categories and figures are combined in long, loosely connected sentences. The overview also compresses comparisons in a way that makes their meaning unclear, such as “much higher for better things or lessen in the number of transport.” Use one paragraph for the positive features, one for drawbacks, and include the third chart in a separate paragraph. Clearer sentence boundaries and more precise links between comparisons would make the organisation easier to follow.
Lexical Resource: Band 5.0
You use some task-related vocabulary, including “range of shops,” “job opportunities,” “traffic congestion,” and “crime rate,” so the reader can identify the broad subject of many comparisons. However, the range is limited and several word choices or collocations make the meaning unclear: “better things,” “bad things,” “houses for renting,” and “cost for transport or living standared.” Spelling errors such as “acdamic,” “munch,” and “standared” also reduce clarity. Aim to use the chart’s category labels accurately and choose neutral report language, such as “positive features,” “drawbacks,” and “cost of housing.” More precise vocabulary would help distinguish the different categories and avoid vague descriptions.
Grammatical Range and Accuracy: Band 5.0
You attempt both simple statements and longer sentences, including a contrast introduced by “While,” but control is inconsistent. Errors in sentence structure and agreement appear in examples such as “The column graph illustrate” and “there will be 45 percent mixture of people.” The opening phrase “survey that conducted” is missing a necessary verb form, and several clauses are joined without clear grammatical boundaries, as in “range of shops much higher almost 50 percent as compared to transport or job opportunities.” These problems sometimes make relationships between figures difficult to understand. Practise accurate present-tense reporting structures, articles and plural forms, and build comparisons with complete clauses—for example, “The proportion choosing shops was higher than the proportion choosing transport.”
See this exact question answered at other band scores. The same prompt compared across bands.
Browse more IELTS Writing model answers or get your own writing scored by the same AI examiner.