Band 5.5 IELTS Writing Task 1 Model Answer
Overall Band Score: 5.5 · IELTS Complete Catalyst · 2026-11-12
IELTS Writing Task 1 question
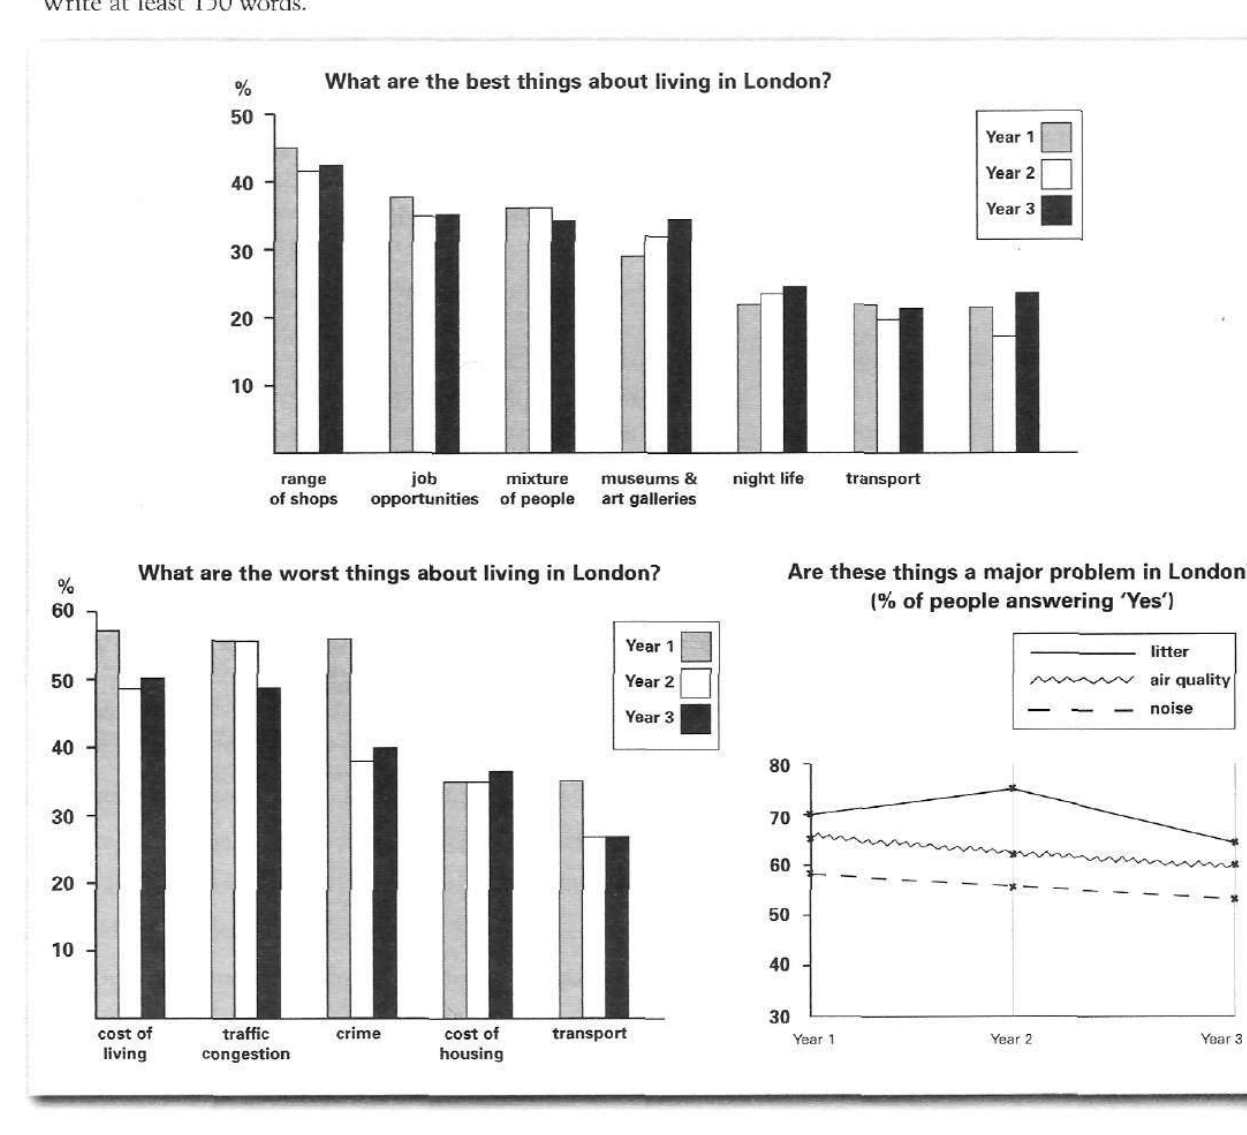
The bar charts and line graph below show the results of a survey conducted over a three-year period to discover what people who live in London think of the city.
Write a report for a university lecturer describing the information below.
What are the best things about living in London?
Student answer (Band 5.5)
According to the diagram the best things about living in London are the range of shops with a percentain above 40%, job oportunities with a percentain aproximatily of 35% and mixture of people also with around a 35%.
For the range of shops, the diagram shows how the first year was better than de other 2 years, the second year represents a decrease and for the third year, it evidenced an lighly increasing but not as much as the first year.
When it comes to job opportunities, the diagram shows how the first year was better compare to the second and third year, which had an decrease during the rest of years.
On the other hand, analyzing the mixture of people, we can see how for the first and second year the percentain were the same while for the third year the mizture of people had a decreased.
For the other aspects such as museums and art galleries, the diagram shows how though the years this topic got better, due to the third year represents a higher percentain compare to the first year.
Even though night life is not one of the best things about living in London, it shows how throught the years has gotten better.
Deftinetely transport is the last best thing in london, its percentain it is between 20% to 30% and even when in the second year had a decreading, on the thirs year increased, but not enought to considere it as one of the best things about libing in London.
AI examiner evaluation
| Criterion | Band |
|---|---|
| Task Achievement / Task Response | 5.5 |
| Coherence and Cohesion | 6.0 |
| Lexical Resource | 5.0 |
| Grammatical Range and Accuracy | 5.5 |
| Overall | 5.5 |
Task Achievement / Task Response: Band 5.5
You identify several key positive features and describe some genuine patterns: shops peak in Year 1, job opportunities are lower in Years 2 and 3, and museums and galleries rise over the period. However, the report covers only the “best things” chart and omits the chart on worst aspects and the line graph about major problems, so it addresses the task only partially. Some details are also inaccurate or unclear: the mixture of people is about the same in Years 1 and 2, but it falls slightly in Year 3; night life rises gradually, while transport falls and then recovers. Add a concise overview comparing the main findings across all three visuals, then select and accurately report the most notable figures and trends.
Coherence and Cohesion: Band 6.0
The response has a generally understandable sequence, moving through the categories in the first chart, and paragraph breaks help separate points. Linking phrases such as “When it comes to” and “On the other hand” signal transitions. However, the organisation follows a list of individual features rather than grouping the information into a clear overview and supporting comparisons. The opening gives no overall summary, and the final point does not function as a conclusion. Some linking is mechanical or imprecise, and references such as “this topic” and “it” are not always clear. Improve progression by introducing the main patterns first, then grouping related rises, falls, and stable figures, with clear references to the relevant category and year.
Lexical Resource: Band 5.0
You use enough topic vocabulary to communicate the categories, including “range of shops,” “job opportunities,” and “museums and art galleries.” There are also attempts at trend language, such as “decrease” and “increased.” However, the range is limited and several noticeable spelling and word-form errors reduce accuracy: “percentain,” “oportunities,” “aproximatily,” “mizture,” and “Deftinetely.” Some expressions are awkward or imprecise, including “the first year was better” and “gotten better,” which do not clearly describe a percentage trend. Use precise reporting verbs and trend vocabulary, and check spelling and collocations. For example, describe figures as “higher” or “lower,” and say that a proportion “rose,” “declined,” or “remained stable.”
Grammatical Range and Accuracy: Band 5.5
You attempt both simple and more complex sentences, using clauses introduced by “when,” “while,” and “even though.” The main meaning is usually recoverable, but some grammatical errors recur. For example, “the first year was better than de other 2 years” has an incorrect article and comparison structure, while “the percentain were the same” has subject–verb disagreement. In “the third year represents a higher percentain compare to the first year,” the tense and comparative construction are not controlled. Several sentences also contain awkward clause structures, such as “it shows how throught the years has gotten better.” Practise accurate past-tense reporting and comparison patterns, and vary sentence forms while checking agreement, articles, and clause construction.
See this exact question answered at other band scores. The same prompt compared across bands.
Browse more IELTS Writing model answers or get your own writing scored by the same AI examiner.