Band 5.0 IELTS Writing Task 1 Model Answer
Overall Band Score: 5.0 · IELTS Complete Catalyst · 2026-11-13
IELTS Writing Task 1 question
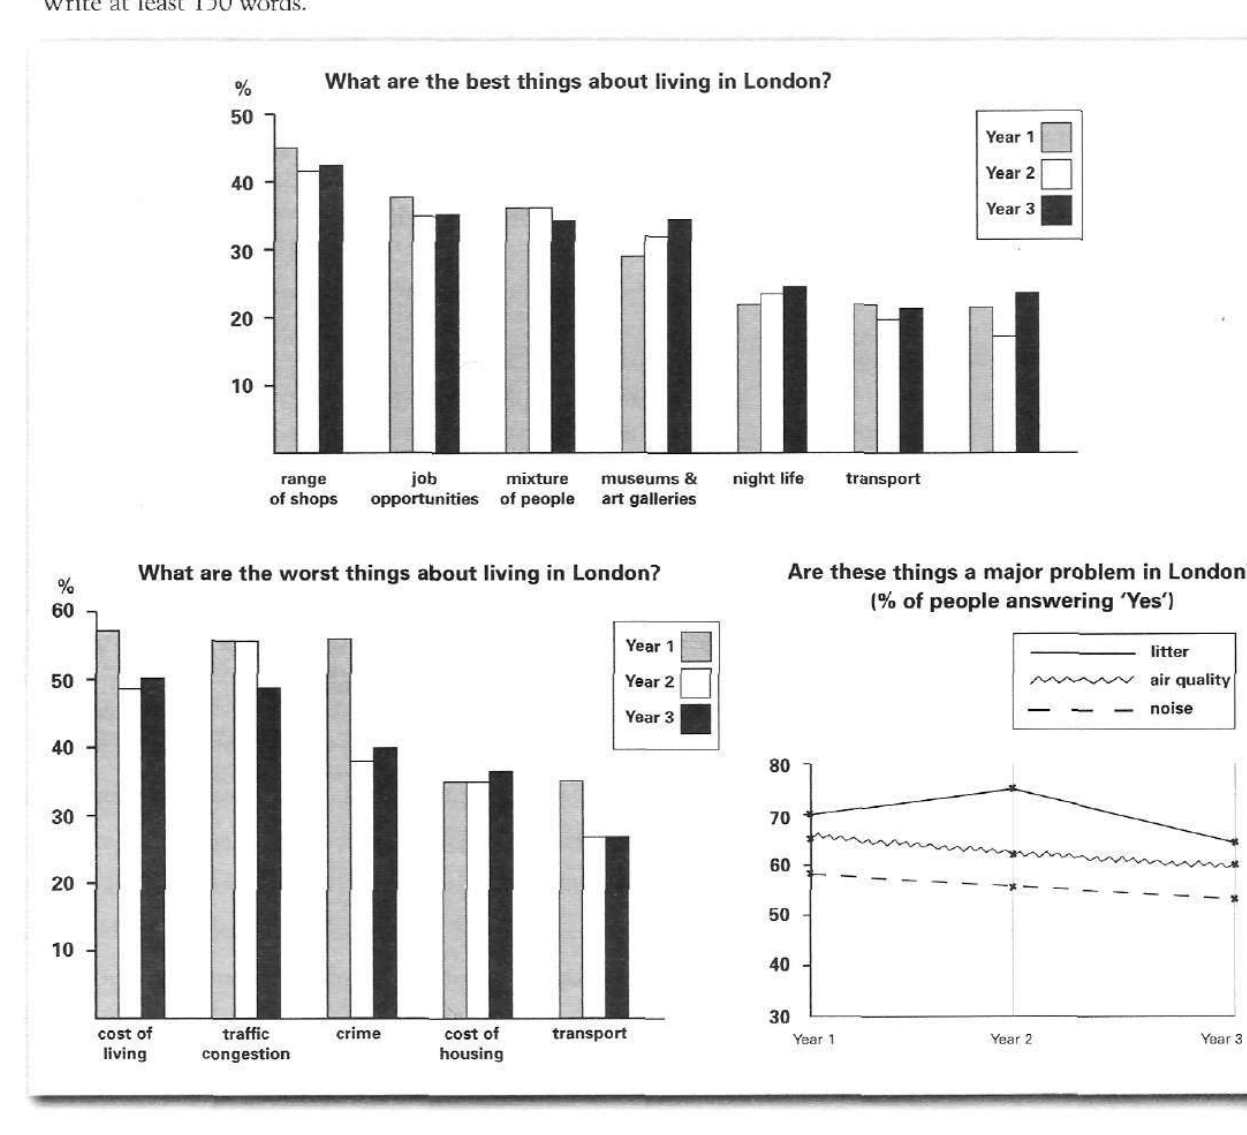
The bar charts and line graph below show the results of a survey conducted over a three-year period to discover what people who live in London think of the city.
Write a report for a university lecturer describing the information below.
What are the best things about living in London?
Student answer (Band 5.0)
The chart illustrates the study related to the lifestyle of London city, its best and worst aspects.Survey is being taken for 3 years which is explained in this graph.
Overall,Best and worst things are being explained like range of shops, job opportunities, micture of people, museam and art galleries, night life, transport, its air and noise quality.As we can see,qualtiy of litter ,air and noise increases in 2nd year and decreases in 3rd year then.Best things about London was high at 1st year but starting decreasing by 2nd and 3rd year and more worst things are being explained.
If we talk about best things,range of shops were 45% by year 1 abd by year 3 it decreases to 42%.wrost things are crime and traffic congestion,by year 1,traffic was at 58% but by 3rd year it was around 52%.Followed by crime the year 1 was 58% anb by 3rd year it was at 48%.
Good aspects decreases from 1st year to 3rd year,but worst aspects being fluctuated between these years.
AI examiner evaluation
| Criterion | Band |
|---|---|
| Task Achievement / Task Response | 5.0 |
| Coherence and Cohesion | 5.0 |
| Lexical Resource | 5.0 |
| Grammatical Range and Accuracy | 5.0 |
| Overall | 5.0 |
Task Achievement / Task Response: Band 5.0
You identify the topic and include a brief overview, then select some relevant figures, such as the range of shops at 45% in Year 1 and around 42% in Year 3. However, the task is only partly covered: the response gives little accurate detail about the full range of best and worst aspects, and it largely omits the separate line graph on litter, air quality and noise. Some reported trends are also unclear or inaccurate. For example, you say the best things generally decreased, although several categories rose or changed only slightly, and the crime figures are not reported correctly. To strengthen the report, summarise the main patterns across all three visuals and support them with a few accurate comparisons.
Coherence and Cohesion: Band 5.0
The response has paragraphs that roughly separate an introduction, overview and details, so the reader can recognise an attempt to organise the report. However, there is no clear progression through the three visuals, and the overview mixes categories and trends without explaining their relationships. Linking phrases such as “If we talk about best things” and “Followed by crime” are repetitive or awkward, while “Good aspects decreases…” repeats an earlier generalisation rather than advancing the comparison. Some references, including “these years” and “it,” are not always clear. A more logical structure would be: introduce the charts, give an accurate overall summary, then describe the best aspects, worst aspects and problem ratings in separate, connected sections.
Lexical Resource: Band 5.0
You use some task-related vocabulary, including “range of shops,” “job opportunities,” “traffic congestion” and “fluctuated,” which helps communicate the subject. However, the range is limited and several word choices or spellings make the report less clear, such as “micture,” “museam,” “qualtiy of litter” and “wrost.” Phrases like “the study related to the lifestyle of London city” and “more worst things are being explained” are also unnatural or imprecise. Aim for concise, conventional chart-report language and use the category labels accurately—for example, “the proportion of respondents who cited…” or “the main drawbacks.” Proofreading spelling and choosing precise terms will make your comparisons easier to follow.
Grammatical Range and Accuracy: Band 5.0
You attempt both simple and more extended sentences, but the range is limited and errors occur frequently. Examples include the sentence fragment “Survey is being taken for 3 years,” the incorrect agreement in “Good aspects decreases,” and the awkward construction “the year 1 was 58%.” Articles, verb forms and sentence boundaries also need attention: “The chart illustrates…” is followed by a run-on introduction, and several sentences lack spaces after full stops or commas. These errors sometimes make the intended comparison difficult to interpret. Practise complete sentences with a clear subject and verb, use past tense consistently for the survey results, and check agreement and punctuation when editing.
See this exact question answered at other band scores. The same prompt compared across bands.
Browse more IELTS Writing model answers or get your own writing scored by the same AI examiner.