Band 6.0 IELTS Writing Task 1 Model Answer
Overall Band Score: 6.0 · IELTS Complete Catalyst · 2026-11-13
IELTS Writing Task 1 question
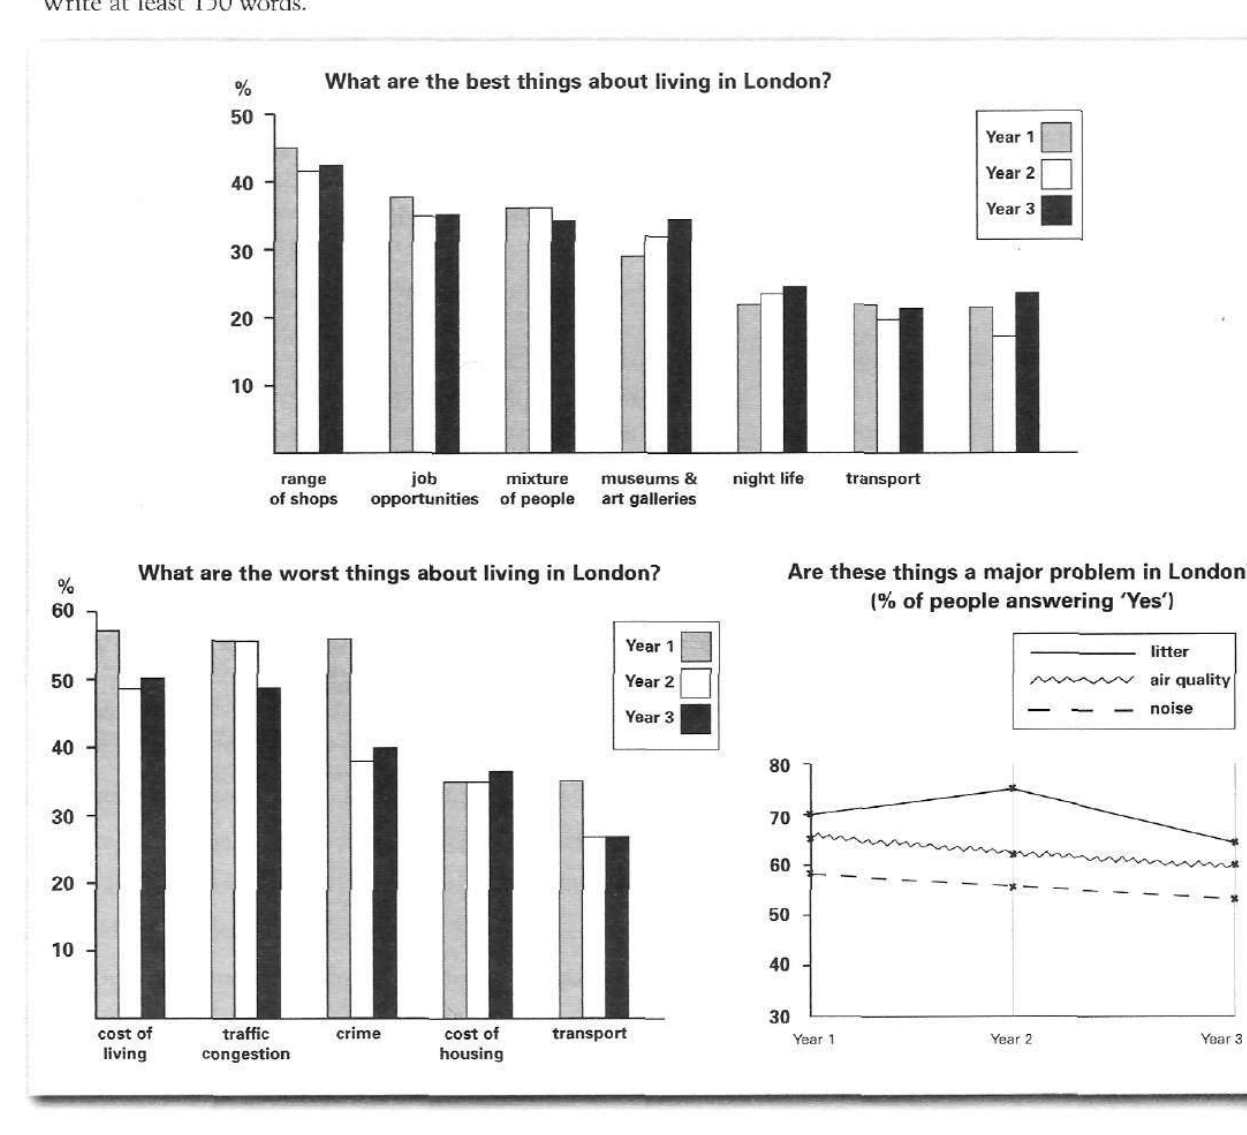
The bar charts and line graph below show the results of a survey conducted over a three-year period to discover what people who live in London think of the city.
Write a report for a university lecturer describing the information below.
What are the best things about living in London?
Student answer (Band 6.0)
The bar charts and line graph illustrates the outcome of a survey happened at year 1, year 2, and year 3 to find out what are the best and worst thing about London city.
Overall, most of the people believes range of shops, job opportunities, and mixture of people have been best things in each year, while cost of living, traffic congestion, and crime has been most worst thing about the city. additionally, the highest proportion of people have agreed ,litter is the serious problem among other.
Regarding bar charts, around 45% of people are satisfied with the range os shops available. Job opportunities,mixture of people, and museums and art gallaries have also placed on better, below 40% of people agreed. Round 30 % of people agrred with night life and transport available each year. While, most of the people approximately above 55%, dislike about the fact of living cost, heavy traffic and crime are bad things about city life per each year. about below 40% of people thinks housing expenditure and transport are worst.
In terms of line graph, it is seen that about 70 percentage of people ageres with litter is a major problem of London each year. Air quality is the second biggest concern of the peoople, as around 65% agree. Approximately 60% of people thinks noise is another issue of the London city.
AI examiner evaluation
| Criterion | Band |
|---|---|
| Task Achievement / Task Response | 6.0 |
| Coherence and Cohesion | 6.5 |
| Lexical Resource | 5.5 |
| Grammatical Range and Accuracy | 5.0 |
| Overall | 6.0 |
Task Achievement / Task Response: Band 6.0
You cover the three visuals and give a clear overall summary: shops, jobs and the mix of people are presented as leading positive features, while litter is identified as the main problem. Several key figures are broadly accurate, including about 45% for shops and roughly 70% for litter. However, the overview overgeneralises: the three positive features do not all lead in every year, and the worst-feature figures change considerably—for example, crime falls from about 56% in Year 1 to around 38–40% later. The claim that more than 55% disliked cost, traffic and crime “per each year” is therefore inaccurate. You also omit notable trends, such as falling concern about air quality and noise. Select and compare these changes more precisely.
Coherence and Cohesion: Band 6.5
The response has a recognisable structure: an introduction, an overview, and separate paragraphs for the bar charts and line graph. This makes the information easy to locate, and phrases such as “Overall,” “Regarding bar charts,” and “In terms of line graph” help signal the stages of the report. The progression is generally clear, but some links are awkward or mechanical, particularly “While, most of the people…” and “Additionally” after a comma. The bar-chart paragraph also groups several categories without a clear year-by-year comparison, so the reader cannot easily follow how values change. Improve cohesion by organising comparisons around trends—for example, stable, rising or falling figures—and use linking phrases accurately.
Lexical Resource: Band 5.5
You use relevant topic vocabulary, including “job opportunities,” “traffic congestion,” “air quality,” and “major problem,” so the subject is generally clear. There is also some attempt to vary wording with “concern” and “issue.” However, noticeable spelling and word-choice errors reduce precision: “gallaries,” “peoople,” “agreed” where “agree” is intended, and “range os shops.” Several expressions are unnatural, such as “placed on better,” “dislike about the fact of living cost,” and “housing expenditure” for the chart’s cost of housing. Repeated use of “people” and “problem” also limits flexibility. Use accurate chart language such as “was considered a positive feature,” “was cited as a drawback,” and “the proportion reporting…”.
Grammatical Range and Accuracy: Band 5.0
You attempt both simple and more complex forms, including the overview contrast with “while” and the sentence beginning “as around 65% agree.” However, errors in agreement, verb forms, articles and sentence construction are frequent enough to make some sentences awkward. For example, “The bar charts and line graph illustrates” needs plural agreement, while “most of the people believes” and “crime has been” do not agree with their subjects. The opening phrase “a survey happened at year 1” is also grammatically unclear; use “a survey conducted over three years.” Punctuation and capitalisation are inconsistent, as in “While,” and “about below 40%.” Practise accurate subject–verb agreement and build comparisons in complete, controlled sentences.
See this exact question answered at other band scores. The same prompt compared across bands.
Browse more IELTS Writing model answers or get your own writing scored by the same AI examiner.