Band 5.5 IELTS Writing Task 1 Model Answer
Overall Band Score: 5.5 · IELTS Complete Catalyst · 2026-11-14
IELTS Writing Task 1 question
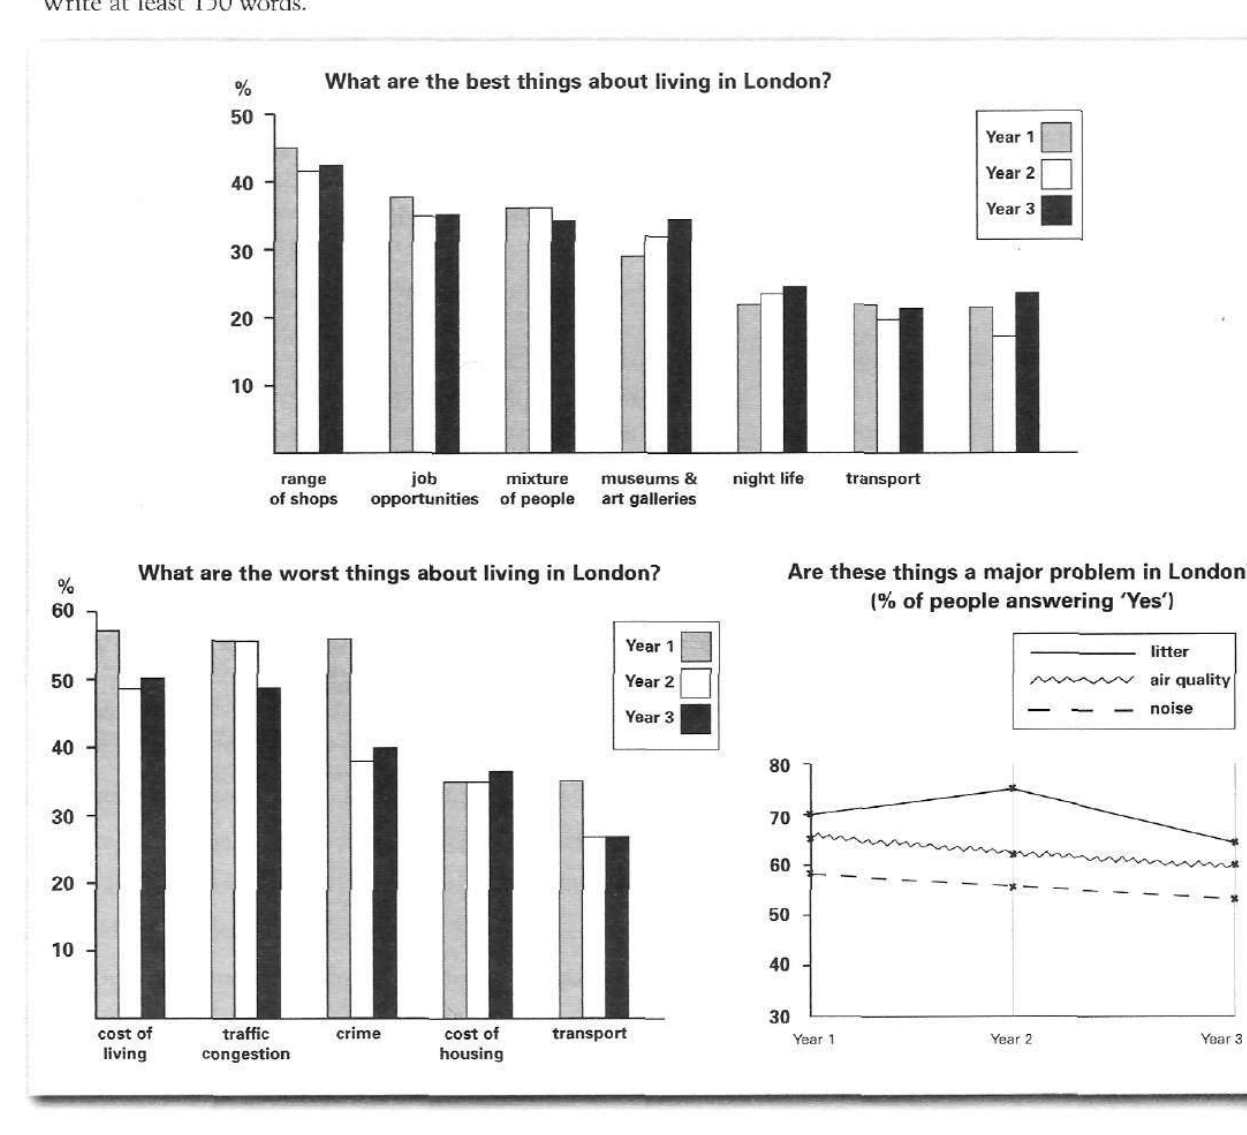
The bar charts and line graph below show the results of a survey conducted over a three-year period to discover what people who live in London think of the city.
Write a report for a university lecturer describing the information below.
What are the best things about living in London?
Student answer (Band 5.5)
The two bar charts and line charts illustrates the best things about living in London over a three year period, the worst things about living in London and how percentage of people answering three different major problem in London.
Overall, the richest best thing about range of shops in living in London and the highest worst traffic congestion about living in London over a three year period. while the major problem in London people said litter answering.
The best things about living in London over a three year period, the range of shops is the most best things at 45% in year 1, 41% in year 2 and 42% in year3. The job opportunities are respectively 37%, 35% and 36%, mixture of people at 36%, 36% and 34%, museum and art galleries is the large amount of year 3 at 37% rather than both year. The night life and transport account for 21%, 23% , 24% and 19%, 17%, 19%. The highest worst traffic congestion, 59% in year 1, 59% in year 2 and 50% in year 3. The highest worst was crime in year 1 at 60%. The cost of living 58%, 50% and 51%, crime at 60%, 40% and 42%, transport at approximently, 41%, 32% and 32% and cost of housing at 35%, 35% and 37%.
The major problem in London people was litter from 70% to 75% between year 1 and 2 then declined to 68% in year 3. The air quality was 67% in year 1, 61% in year 2 and 60% in year3.
AI examiner evaluation
| Criterion | Band |
|---|---|
| Task Achievement / Task Response | 5.5 |
| Coherence and Cohesion | 5.5 |
| Lexical Resource | 5.0 |
| Grammatical Range and Accuracy | 5.0 |
| Overall | 5.5 |
Task Achievement / Task Response: Band 5.5
You cover the three visuals and identify several relevant features, including shops as a leading positive, traffic congestion as a major drawback, and litter as the most widely reported problem. However, the overview is unclear and some comparisons are inaccurate or incomplete. For example, traffic congestion is not the highest negative in Year 1: crime is about 56%, slightly above congestion at roughly 56% (the chart values are close), while congestion is highest in Year 2. You also omit the noise figures and give some positive-category values inaccurately, such as museums and galleries at 37% in Year 3 rather than about 35%. A clearer overview and more reliable selection of key comparisons would make the report more complete.
Coherence and Cohesion: Band 5.5
The response has a basic structure: an introduction, an overview, and a paragraph describing the charts. This gives the reader some sense of how the information is organised. However, progression within the main paragraph is difficult to follow because positive and negative features are combined without a clear transition, and several details are crowded into long lists. The overview also contains fragmented connections, as in “while the major problem in London people said litter answering.” Use separate paragraphs for the positive and negative charts, then a final paragraph for the line graph. Linking phrases such as “By contrast” and “Regarding reported problems” would clarify shifts between visuals and help the report develop more logically.
Lexical Resource: Band 5.0
You use relevant chart vocabulary, including “percentage,” “declined,” “account for,” and “respectively,” so the reader can recognise the intended comparisons. However, the range is limited and several phrases are unnatural or imprecise, such as “the richest best thing,” “the most best things,” and “the highest worst.” These choices sometimes make the meaning difficult to interpret. There are also spelling and word-form errors, including “approximently,” and repeated use of “things” where more precise labels would help. Aim to use standard reporting language and the chart’s category names consistently, for example “the most popular advantage” or “the leading disadvantage.”
Grammatical Range and Accuracy: Band 5.0
The response attempts some longer sentences and comparisons, but grammatical control is inconsistent, and errors frequently affect clarity. The opening has subject–verb disagreement in “The two bar charts and line charts illustrates,” while “how percentage of people answering three different major problem” lacks necessary articles and plural forms. Sentence boundaries and punctuation are also problematic: the overview joins separate ideas with a full stop followed by “while,” and the long data sentence is difficult to parse. Most statements rely on simple listing rather than controlled complex structures. Practise accurate comparison patterns such as “The figure for X rose from … to …, before falling to …” and check agreement, articles, and sentence boundaries.
See this exact question answered at other band scores. The same prompt compared across bands.
Browse more IELTS Writing model answers or get your own writing scored by the same AI examiner.