Band 5.5 IELTS Writing Task 1 Model Answer
Overall Band Score: 5.5 · IELTS Complete Catalyst · 2026-11-14
IELTS Writing Task 1 question
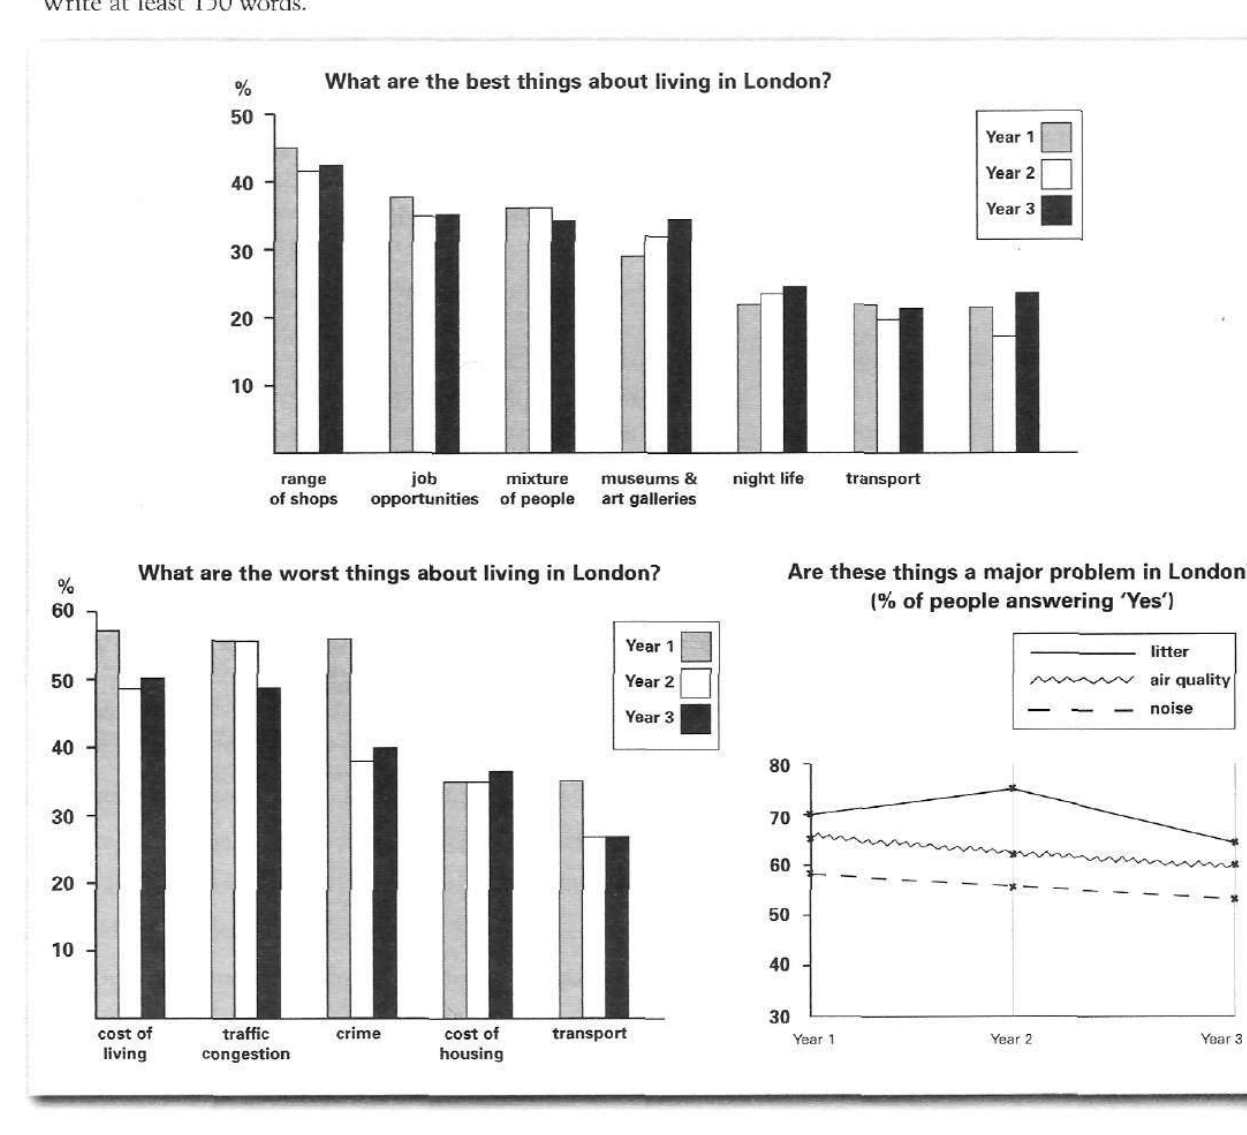
The bar charts and line graph below show the results of a survey conducted over a three-year period to discover what people who live in London think of the city.
Write a report for a university lecturer describing the information below.
What are the best things about living in London?
Student answer (Band 5.5)
The bar graph and line graph illustrates the graph of change in best things and worst thing that happened over the three year period in London.
Overall,the range of shops were the most popular things about living in London while traffic congestion and high crime rates were the worst things about living in London.Moreover, litter is the major issue in London.
Furthermore, top best things about living in London were range of shops, job opportunities, mixture of people , museums and art galleries as more 1/3 of the citizens were in vote of it in vote of it. While 1/4 of the people also favoured its night life and trasnsport as best thing.
Additionally, cost of living, traffic congestion, crime rates were more than fifty percent in year one, later they declined in year two and three. Litter was the major issue in London as more than 2/3 population inscribed in all three years.
AI examiner evaluation
| Criterion | Band |
|---|---|
| Task Achievement / Task Response | 5.5 |
| Coherence and Cohesion | 6.0 |
| Lexical Resource | 5.5 |
| Grammatical Range and Accuracy | 5.0 |
| Overall | 5.5 |
Task Achievement / Task Response: Band 5.5
You identify several central features, including the range of shops as the leading positive feature and litter as a major problem, and you compare the first year with later years for some negative factors. However, coverage is partial: the report gives few precise figures and does not describe the line graph’s downward trends for litter, air quality and noise. Some claims are inaccurate or too broad. For example, traffic congestion and crime were not both above 50% in every year, and the negative factors did not all decline in both later years. The statement that night life and transport were each favoured by about a quarter is also not consistently supported. Select key comparisons and report their approximate percentages accurately to make the overview and details clearer.
Coherence and Cohesion: Band 6.0
The response has a recognisable overall arrangement: an opening, an overview, and paragraphs covering positive and negative features. This gives the reader a basic route through the information, and linking expressions such as “Overall,” “Furthermore,” and “Additionally” help signal shifts. However, progression within the paragraphs is limited, and the final paragraph combines several categories without clearly distinguishing their trends. The sentence beginning “Furthermore” lists positive features but does not organise them by rank or change over time. Some transitions are mechanical, while “While” introduces a fragment rather than a complete contrast. Group the information more deliberately—for example, positive features in one paragraph and negative features and problem ratings in another—and use comparisons to connect the data.
Lexical Resource: Band 5.5
You use relevant topic vocabulary, including “range of shops,” “job opportunities,” “traffic congestion,” and “air quality,” so the subject is generally clear. There are also attempts at more formal reporting language, such as “Overall” and “favoured.” However, several word choices and collocations are inaccurate or unnatural, which limits precision: “the graph of change,” “things that happened,” and “inscribed in all three years” do not express the intended survey findings naturally. Repetition of “best things” and “living in London” also narrows the range. Aim for standard chart-reporting phrases such as “the proportion of respondents who selected…” and use “problem” or “concern” for negative features. Check spelling, including “transport.”
Grammatical Range and Accuracy: Band 5.0
The response attempts both simple and more extended sentences, and the main message is usually understandable. However, control is inconsistent, with errors in agreement, articles, sentence boundaries and punctuation. For example, “The bar graph and line graph illustrates” has a plural subject with a singular verb, while “the range of shops were” also has faulty agreement. “While 1/4 of the people…” is an incomplete sentence, and the opening has awkward article and noun phrasing. Commas are often followed by no space, and there are extra spaces within sentences. Build accuracy first with clear complete sentences, then add controlled comparisons using clauses such as “whereas” or “while.” Review subject–verb agreement and punctuation when editing.
See this exact question answered at other band scores. The same prompt compared across bands.
Browse more IELTS Writing model answers or get your own writing scored by the same AI examiner.