Band 5.0 IELTS Writing Task 1 Model Answer
Overall Band Score: 5.0 · IELTS Complete Catalyst · 2026-11-15
IELTS Writing Task 1 question
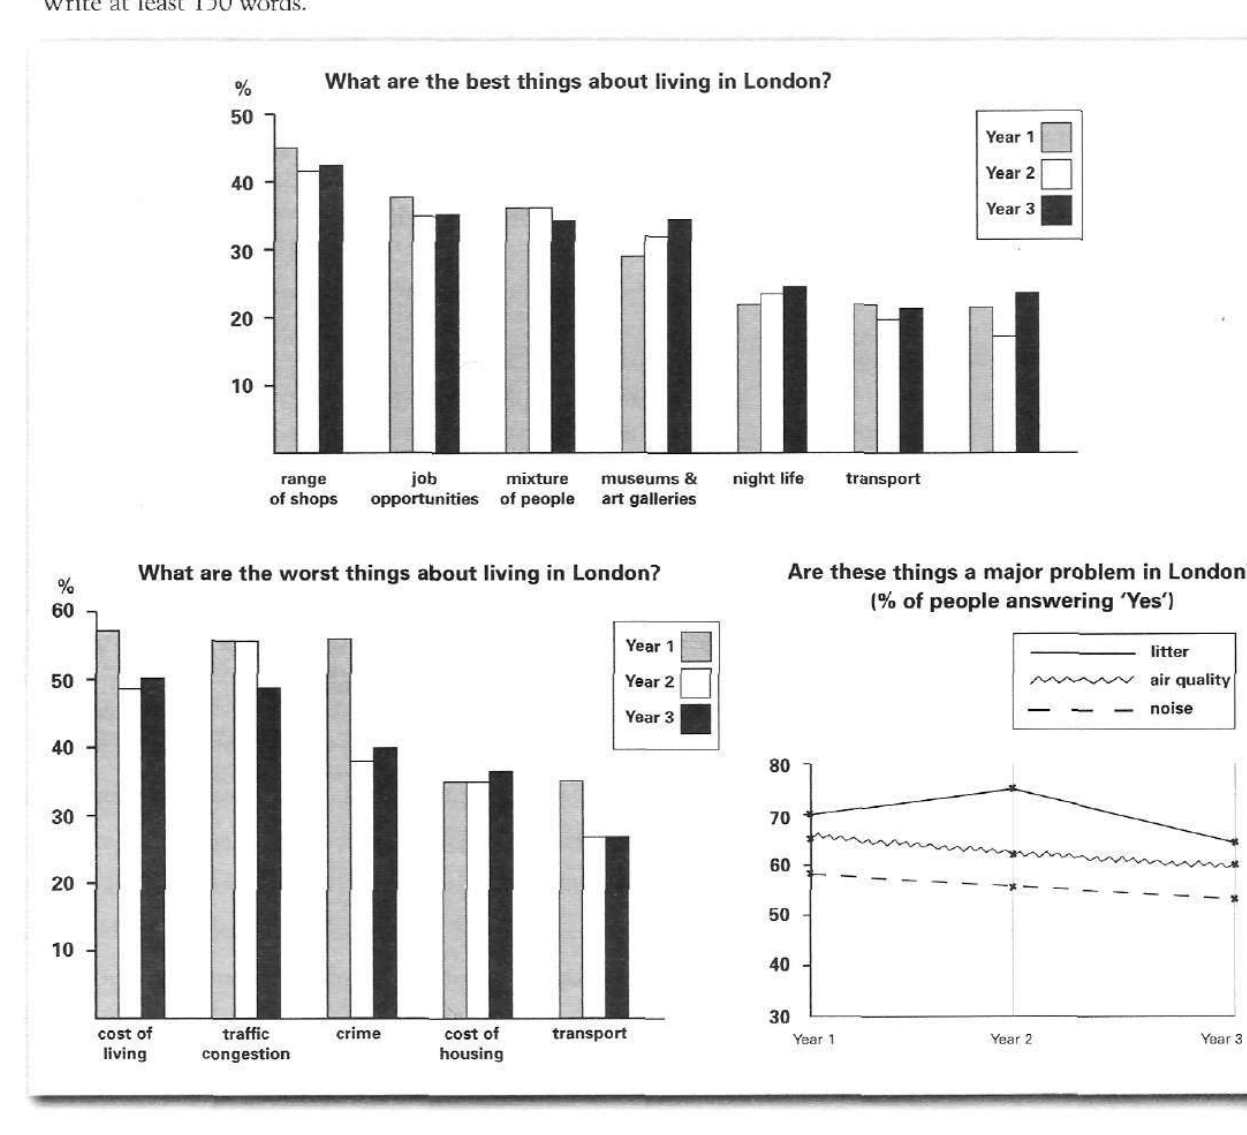
The bar charts and line graph below show the results of a survey conducted over a three-year period to discover what people who live in London think of the city.
Write a report for a university lecturer describing the information below.
What are the best things about living in London?
Student answer (Band 5.0)
This bar chart shows both best and worst things about London. Over a period of time things changes a lot. First looking at the ranges of shops, in a three years of time, the shops ranges are almost constant. But in the first year the ranges are 45%, in second year ranges down to 42% and in the third year the ranges slightly increased to 43%.
The next thing is job oppoturnitues. In the first year jobnopportunities are 39%, but in the next two years, these are decreased by two percent. Mixture of people in the first two years in constant at 38%. But in the third year the percentage decreased by 1%. Things about meusums and gallerires are very satisfying because these increased every year. And same about the night life in London, which is increased every year. The thing is transport which which decreased in the second year from 20% to 18%. But in the third year in increases slightly.
AI examiner evaluation
| Criterion | Band |
|---|---|
| Task Achievement / Task Response | 4.0 |
| Coherence and Cohesion | 5.0 |
| Lexical Resource | 5.0 |
| Grammatical Range and Accuracy | 5.0 |
| Overall | 5.0 |
Task Achievement / Task Response: Band 4.0
You identify the topic and describe several features in the first chart, including shops, jobs, population mix, museums, nightlife and transport. However, the response addresses only the “best things” chart and omits both the chart of worst aspects and the line graph about whether issues are major problems. This leaves most of the task uncovered. Some reported figures and trends are also inaccurate: for example, shops are about 45%, 41.5% and 42.5%, rather than 45%, 42% and 43%; the mixture of people is around 36%, 36% and 34%, not 38% in the first two years. There is no clear overview of the main patterns. To improve, summarise all three visuals and select accurate key comparisons before giving details.
Coherence and Cohesion: Band 5.0
The response has a basic sequence, moving through categories in the first chart, and phrases such as “First looking at” and “The next thing” help signal the order. However, the organisation is limited to one paragraph and does not give the report a clear overall progression: there is no overview followed by organised detail, and the two other visuals are not incorporated. Linking is repetitive and sometimes awkward, as in “And same about the night life” and “But in the third year”. Grouping related trends into paragraphs and using clearer comparisons between years would make the information easier to follow. A concise opening overview, followed by separate sections for positive features, drawbacks and major problems, would provide a more coherent structure.
Lexical Resource: Band 5.0
You use some relevant topic vocabulary, including “job opportunities”, “mixture of people”, “museums and galleries” and “percentage”, so the reader can generally identify the categories being discussed. However, the range is limited and several word-choice, collocation and spelling errors reduce precision: “ranges of shops” is not a natural way to describe this category, while “very satisfying” does not accurately express that a survey figure increased. There are also misspellings such as “oppoturnitues” and “meusums”. Repeated use of “thing” and “increased” makes the account less precise. Practise accurate chart vocabulary such as “proportion”, “figure”, “rose”, “fell” and “remained stable”, and check spelling before submitting.
Grammatical Range and Accuracy: Band 5.0
You attempt some longer sentences, including “But in the first year the ranges are 45%, in second year ranges down to 42% and in the third year the ranges slightly increased to 43%.” However, the response relies mainly on simple sentence patterns, and attempts to describe changes often contain errors in tense, agreement or sentence construction. Examples include “things changes a lot”, “Mixture of people in the first two years in constant” and “which which decreased”. Articles are also missing in phrases such as “in second year”. These errors sometimes make relationships between figures unclear. Use consistent past-tense reporting, check subject–verb agreement, and practise accurate comparative structures such as “the figure fell from … to … before rising slightly”.
See this exact question answered at other band scores. The same prompt compared across bands.
Browse more IELTS Writing model answers or get your own writing scored by the same AI examiner.