Band 5.0 IELTS Writing Task 1 Model Answer
Overall Band Score: 5.0 · IELTS Complete Catalyst · 2026-11-15
IELTS Writing Task 1 question
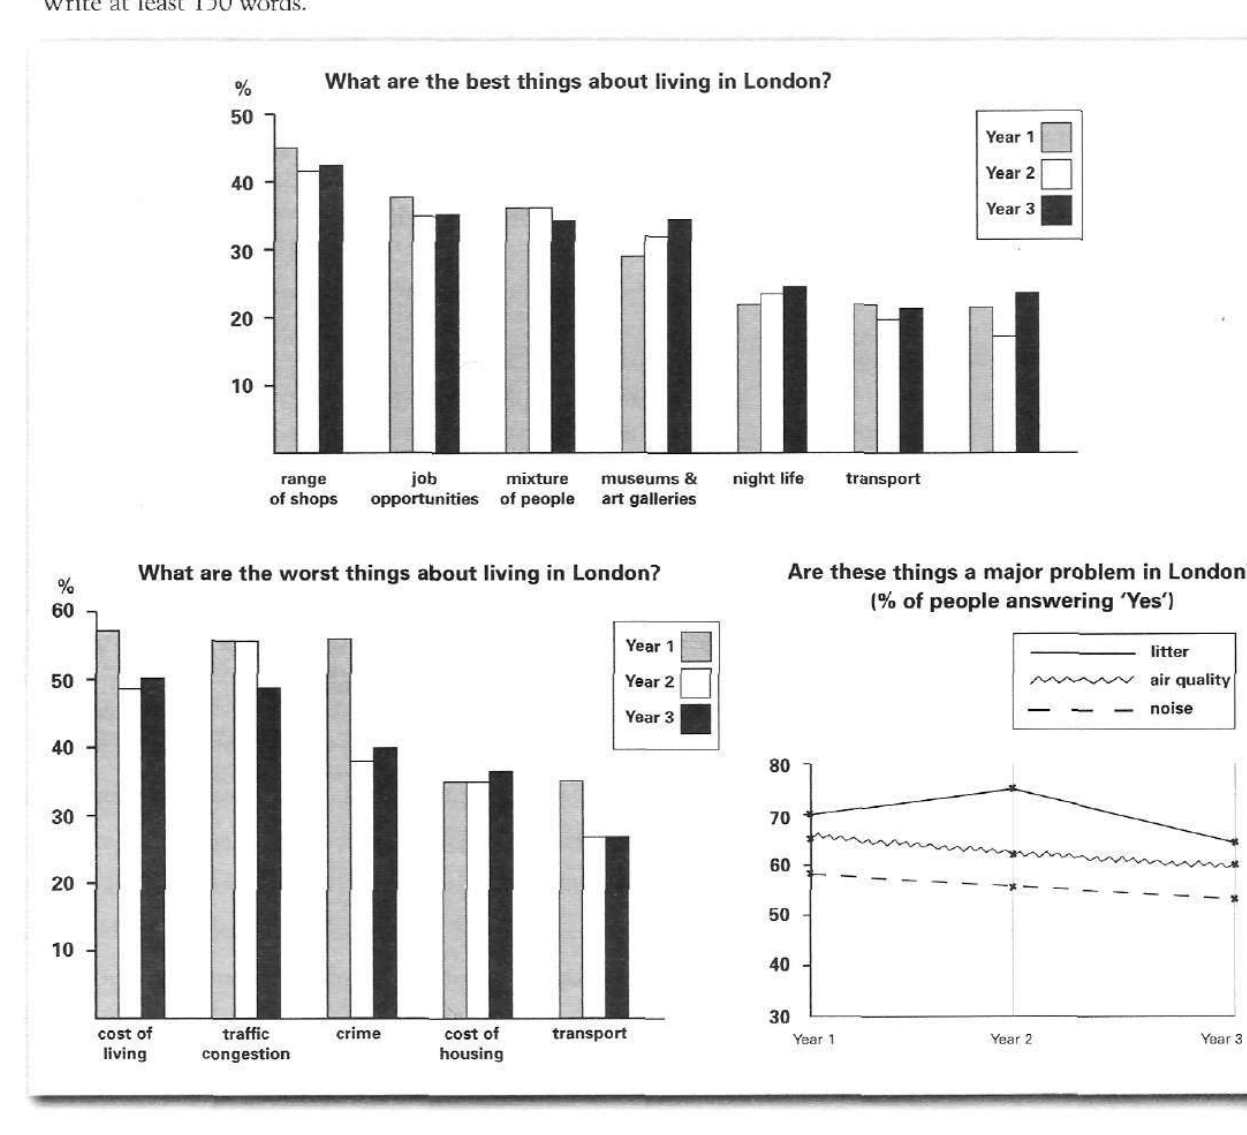
The bar charts and line graph below show the results of a survey conducted over a three-year period to discover what people who live in London think of the city.
Write a report for a university lecturer describing the information below.
What are the best things about living in London?
Student answer (Band 5.0)
The given bar graph and line graph below represents what people in London think about the city over a three year period.
The first graph shows us about what are the best things about living in London that include Shops, job opportunities, mixture of people, museum and art galleries, night life and transport and who they have been increasing or decreasing over the three year period.
Whereas, the second graph shows us about the worst things in London during those three years that includes cost of living, traffic congestion, crime, cost of housing and transport that has shown a rapid changes through the years.
The line graph portraits the major problems in London that were litter that seen at 70% in the first year and then increased in the 2nd year and the reduced to 65% in the 3rd year. The biggest problem was air quality that was between 60-67 percent during those years, The third problem was noise which was about 54- 59 percent in those years.
AI examiner evaluation
| Criterion | Band |
|---|---|
| Task Achievement / Task Response | 4.0 |
| Coherence and Cohesion | 5.5 |
| Lexical Resource | 5.0 |
| Grammatical Range and Accuracy | 5.0 |
| Overall | 5.0 |
Task Achievement / Task Response: Band 4.0
The response identifies the three visuals and gives a few relevant details about the line graph, including litter rising from about 70% to 75% before falling to 65%, and noise declining over the period. However, it does not provide a clear overview of the main patterns across the charts, and the two bar charts are only listed rather than described with figures or comparisons. The statement that air quality was “the biggest problem” is inaccurate: litter had the highest percentages in all three years. The ranges given for air quality and noise are also imprecise and do not show their downward trends clearly. To address the task more fully, summarise the leading positive and negative features and compare key changes across all three visuals.
Coherence and Cohesion: Band 5.5
The response has a basic sequence: it introduces the charts, describes the two bar charts, and then turns to the line graph. The use of “Whereas” signals a contrast, and the final paragraph groups the line-graph information together. However, the first two body paragraphs mainly announce what each chart contains, so the report does not progress from an overview to meaningful comparisons. The opening sentence and the following chart descriptions are also repetitive. In the final paragraph, several details are joined into one long sentence, and the capitalised “The” after a comma interrupts the flow. Organise the report around an overview and selected comparisons, using clear paragraph breaks and linking ideas more precisely.
Lexical Resource: Band 5.0
The response uses relevant topic vocabulary such as “job opportunities,” “traffic congestion,” “cost of living,” and “air quality,” so the reader can identify the chart categories. However, the range is limited, with repeated reliance on “shows” and “problem,” and some word choices or collocations are inaccurate: “portraits” is not suitable for describing a graph, and “rapid changes” is unsupported by the data. “Museum and art galleries” also does not accurately reproduce the category label. Use a wider range of precise reporting language, such as “accounts for,” “remained stable,” or “declined,” and check that category names and descriptions match the visual.
Grammatical Range and Accuracy: Band 5.0
The response attempts both simple statements and longer clauses, but control is uneven. For example, “The given bar graph and line graph below represents” has a subject–verb agreement error, while “that include … and who they have been increasing or decreasing” is an incomplete and confusing construction. The second chart description also shifts between plural categories and singular “that has shown.” In the final paragraph, “that seen at 70%” is missing a verb, and the sentence beginning “The biggest problem…” contains a comma splice and an unnecessary capital letter after the comma. These errors sometimes make relationships between ideas difficult to follow. Practise accurate relative clauses and sentence boundaries, and check agreement and verb forms when editing.
See this exact question answered at other band scores. The same prompt compared across bands.
Browse more IELTS Writing model answers or get your own writing scored by the same AI examiner.